empty
08.05.2023 10:39 PM
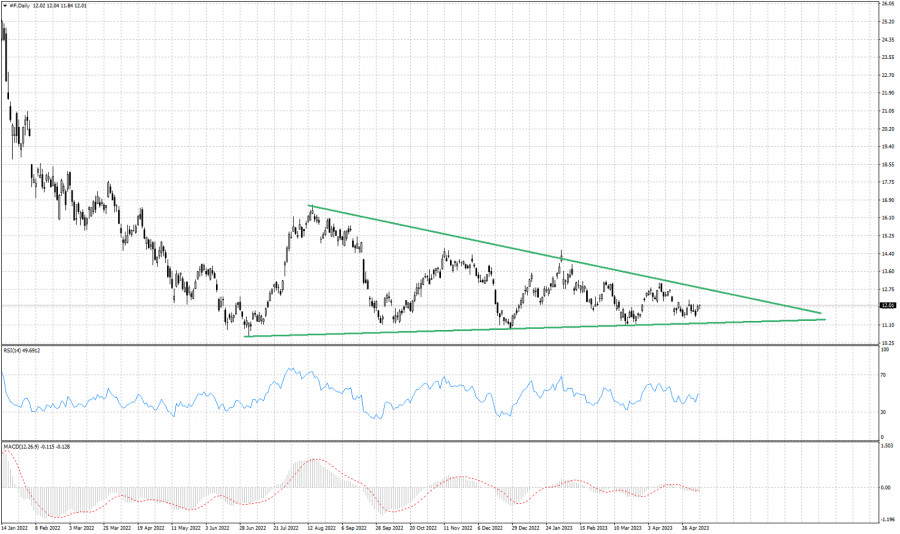
Ford stock price continues to trade inside a triangle pattern since last year.

This image is no longer relevant

Green lines- triangle pattern

Over the last 9 months, Ford's stock price has been trading in a relatively narrow range between $7.50 and $12.50. During this period, the stock has formed a triangle pattern on the daily chart, with the upper trendline connecting the highs and the lower trendline connecting the lows. The triangle pattern suggests that Ford's stock price is consolidating and that a breakout may be imminent. If the stock breaks above the upper trendline, it could signal a bullish continuation and a potential move towards the $13.50 to $14.00 range. On the other hand, if price breaks below the lower trendline, it could signal a bearish reversal and a potential move towards the $6.50 to $7.00 range. The Relative Strength Index (RSI) is currently hovering around the midpoint, indicating that the stock is neither overbought nor oversold. The Moving Average Convergence Divergence (MACD) indicator is also showing a neutral signal, with the MACD line and signal line crossing each other multiple times over the past few months. Overall, the technical outlook for Ford's stock price remains uncertain as it continues to trade within the triangle pattern. Traders and investors should keep a close eye on the upper and lower trendlines for potential breakout signals.

Alexandros Yfantis,
الخبير التحليلي لدى شركة إنستافوركس
© 2007-2025
Summary
Urgency
Analytic
Alexandros Yfantis
Start trade
كسب عائد من تغيرات أسعار العملات المشفرة مع إنستافوركس.
قم بتحميل منصة التداول ميتاتريدر 4 وافتح أول صفقة.
  • Grand Choice
    Contest by
    InstaForex
    InstaForex always strives to help you
    fulfill your biggest dreams.
    انضم إلى المسابقة

المقالات الموصى بها

سوق الأسهم الأمريكية يستعد للتراجع بعد ثلاثة أشهر من الارتفاع المستمر

ينتهي شهر يوليو بانتصار آخر للمضاربين على الصعود: حيث أغلق مؤشر S&P 500 على ارتفاع للشهر الثالث على التوالي، محققًا مستوى قياسيًا جديدًا عند 6,427. لكن يبدو أن هذا الانتصار

Anna Zotova 12:39 2025-08-01 UTC+2

سوق الأسهم الأمريكية في الأول من أغسطس: مؤشر S&P 500 وNASDAQ يواصلان تراجعهما

أنهت مؤشرات الأسهم الأمريكية تداولاتها على انخفاض مرة أخرى أمس، حيث تراجع مؤشر S&P 500 بنسبة 0.37%، وانخفض مؤشر Nasdaq 100 بنسبة 0.04%. كما هبط مؤشر Dow Jones Industrial Average

Jakub Novak 10:37 2025-08-01 UTC+2

سوق الأسهم اعتبارًا من 31 يوليو: مؤشر S&P 500 وناسداك يحافظان على مواقعهما

في نهاية جلسة التداول السابقة، أغلقت مؤشرات الأسهم الأمريكية على تباين. حيث انخفض مؤشر S&P 500 بنسبة 0.12%، بينما ارتفع مؤشر Nasdaq 100 بنسبة 0.15%. وتراجع مؤشر Dow Jones الصناعي

Jakub Novak 10:06 2025-07-31 UTC+2

اجتماع بنك اليابان وثلاث إشارات أخرى لا يمكنك تفويتها هذا الأسبوع

الأسواق العالمية تعاني من اضطرابات: المستثمرون يزنون مخاطر هبوط جديد في الين وسط حالة من عدم اليقين السياسي واجتماع بنك اليابان القادم. في الوقت نفسه، يسجل خام برنت ارتفاعات محلية

Аlena Ivannitskaya 13:22 2025-07-30 UTC+2

الأسهم الأمريكية: منطقة شراء مفرط أم وضع طبيعي جديد؟

بينما يتراجع سوق الأسهم الأمريكي من مستوى قياسي جديد، يستمر مؤشر بافيت في تسجيل أرقام قياسية جديدة. للتذكير، يعكس مؤشر وارن بافيت نسبة القيمة السوقية للأسهم الأمريكية إلى الناتج المحلي

Jakub Novak 10:48 2025-07-30 UTC+2

سوق الأسهم في 30 يوليو: SP500 وNASDAQ يواصلان تصحيحاتهم

أنهت مؤشرات الأسهم الأمريكية تداولات يوم الجمعة الماضي بانخفاض. حيث تراجع مؤشر S&P 500 بنسبة 0.30%، وانخفض مؤشر Nasdaq 100 بنسبة 0.30%. كما فقد مؤشر Dow Jones الصناعي نسبة 0.46%

Jakub Novak 09:24 2025-07-30 UTC+2

تحديث حول سوق الأسهم الأمريكية في 29 يوليو. SP500 وNASDAQ يمران بمرحلة تصحيح

أغلقت مؤشرات الأسهم الأمريكية على تباين يوم الجمعة الماضي. ارتفع مؤشر S&P 500 بنسبة 0.02%، بينما أضاف مؤشر Nasdaq 100 نسبة 0.33%. في المقابل، تراجع مؤشر Dow Jones الصناعي بنسبة

Jakub Novak 09:28 2025-07-29 UTC+2

سوق الأسهم في 28 يوليو: مؤشر S&P 500 وNASDAQ يسجلان أعلى مستويات جديدة على الإطلاق

أغلقت مؤشرات الأسهم الأمريكية يوم الجمعة الماضي على ارتفاع. حيث ارتفع مؤشر S&P 500 بنسبة 0.40%، بينما أضاف مؤشر Nasdaq 100 نسبة 0.20%. كما عزز مؤشر Dow Jones Industrial Average

Jakub Novak 09:29 2025-07-28 UTC+2

تحديث سوق الأسهم ليوم 25 يوليو: توقف مؤشر S&P 500 وNASDAQ بعد الارتفاع

اعتبارًا من 25 يوليو، أظهرت مؤشرات الأسهم الأمريكية أداءً متباينًا. حيث ارتفع مؤشر S&P 500 بنسبة 0.07%، بينما زاد مؤشر Nasdaq 100 بنسبة 0.17%. في المقابل، تراجع مؤشر Dow Jones

Jakub Novak 11:17 2025-07-25 UTC+2

ترامب يبرم صفقة مع اليابان - وعناوين رئيسية أخرى تؤثر على محفظتك الاستثمارية

الأسواق تستعد لموجة جديدة من الاضطرابات: ترامب يبرم صفقة تعريفات مع اليابان، Apple تتجنب غرامات بملايين الدولارات، Amazon تتحدى Meta وOpenAI، وAstraZeneca تبني إمبراطورية صيدلانية في الولايات المتحدة وسط ارتفاع

Аlena Ivannitskaya 13:14 2025-07-23 UTC+2
لا تستطيع التحدث الآن؟
اطرح سؤالك في الدردشة.
Widget callback
 

Dear visitor,

Your IP address shows that you are currently located in the USA. If you are a resident of the United States, you are prohibited from using the services of InstaFintech Group including online trading, online transfers, deposit/withdrawal of funds, etc.

If you think you are seeing this message by mistake and your location is not the US, kindly proceed to the website. Otherwise, you must leave the website in order to comply with government restrictions.

Why does your IP address show your location as the USA?

  • - you are using a VPN provided by a hosting company based in the United States;
  • - your IP does not have proper WHOIS records;
  • - an error occurred in the WHOIS geolocation database.

Please confirm whether you are a US resident or not by clicking the relevant button below. If you choose the wrong option, being a US resident, you will not be able to open an account with InstaForex anyway.

We are sorry for any inconvenience caused by this message.