


signal strength 1 of 5
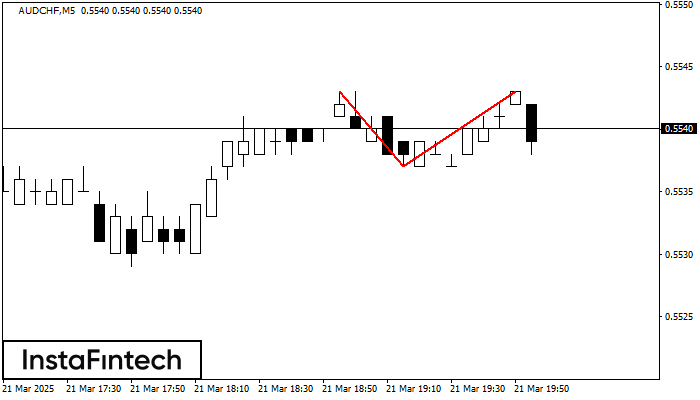
The Double Top reversal pattern has been formed on AUDCHF M5. Characteristics: the upper boundary 0.5543; the lower boundary 0.5537; the width of the pattern is 6 points. Sell trades are better to be opened below the lower boundary 0.5537 with a possible movements towards the 0.5522 level.
The M5 and M15 time frames may have more false entry points.
انظر أيضا
- All
- Double Top
- Flag
- Head and Shoulders
- Pennant
- Rectangle
- Triangle
- Triple top
- All
- #AAPL
- #AMZN
- #Bitcoin
- #EBAY
- #FB
- #GOOG
- #INTC
- #KO
- #MA
- #MCD
- #MSFT
- #NTDOY
- #PEP
- #TSLA
- #TWTR
- AUDCAD
- AUDCHF
- AUDJPY
- AUDUSD
- EURCAD
- EURCHF
- EURGBP
- EURJPY
- EURNZD
- EURRUB
- EURUSD
- GBPAUD
- GBPCHF
- GBPJPY
- GBPUSD
- GOLD
- NZDCAD
- NZDCHF
- NZDJPY
- NZDUSD
- SILVER
- USDCAD
- USDCHF
- USDJPY
- USDRUB
- All
- M5
- M15
- M30
- H1
- D1
- All
- Buy
- Sale
- All
- 1
- 2
- 3
- 4
- 5
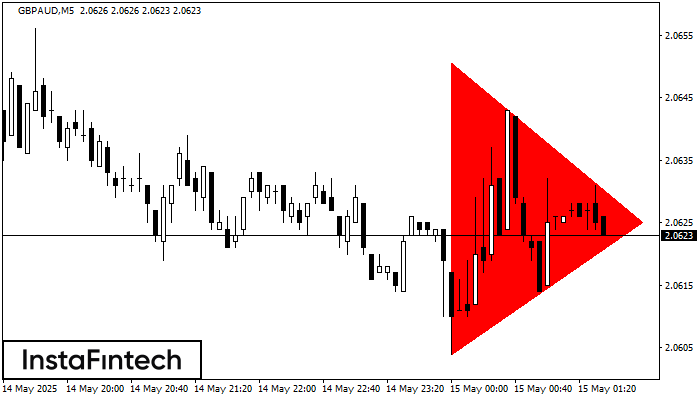
According to the chart of M5, GBPAUD formed the Bearish Symmetrical Triangle pattern. Trading recommendations: A breach of the lower border 2.0604 is likely to encourage a continuation
The M5 and M15 time frames may have more false entry points.
Open chart in a new window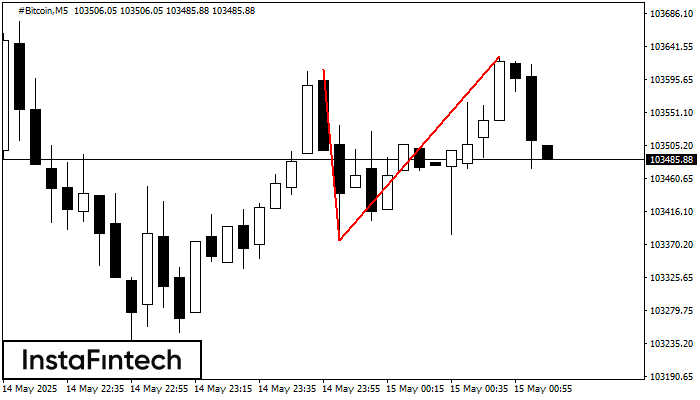
On the chart of #Bitcoin M5 the Double Top reversal pattern has been formed. Characteristics: the upper boundary 103626.65; the lower boundary 103376.20; the width of the pattern 25045 points
The M5 and M15 time frames may have more false entry points.
Open chart in a new window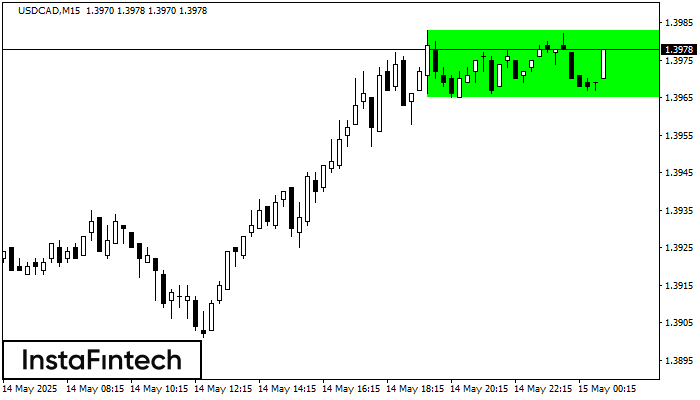
According to the chart of M15, USDCAD formed the Bullish Rectangle. This type of a pattern indicates a trend continuation. It consists of two levels: resistance 1.3983 and support 1.3965
The M5 and M15 time frames may have more false entry points.
Open chart in a new window


