

signal strength 1 of 5

According to the chart of M5, #GOOG formed the Bullish Symmetrical Triangle pattern, which signals the trend will continue. Description. The upper border of the pattern touches the coordinates 165.68/165.13 whereas the lower border goes across 164.59/165.13. The pattern width is measured on the chart at 109 pips. If the Bullish Symmetrical Triangle pattern is in progress during the upward trend, this indicates the current trend will go on. In case 165.13 is broken, the price could continue its move toward 165.28.
The M5 and M15 time frames may have more false entry points.
انظر أيضا
- All
- Double Top
- Flag
- Head and Shoulders
- Pennant
- Rectangle
- Triangle
- Triple top
- All
- #AAPL
- #AMZN
- #Bitcoin
- #EBAY
- #FB
- #GOOG
- #INTC
- #KO
- #MA
- #MCD
- #MSFT
- #NTDOY
- #PEP
- #TSLA
- #TWTR
- AUDCAD
- AUDCHF
- AUDJPY
- AUDUSD
- EURCAD
- EURCHF
- EURGBP
- EURJPY
- EURNZD
- EURRUB
- EURUSD
- GBPAUD
- GBPCHF
- GBPJPY
- GBPUSD
- GOLD
- NZDCAD
- NZDCHF
- NZDJPY
- NZDUSD
- SILVER
- USDCAD
- USDCHF
- USDJPY
- USDRUB
- All
- M5
- M15
- M30
- H1
- D1
- All
- Buy
- Sale
- All
- 1
- 2
- 3
- 4
- 5
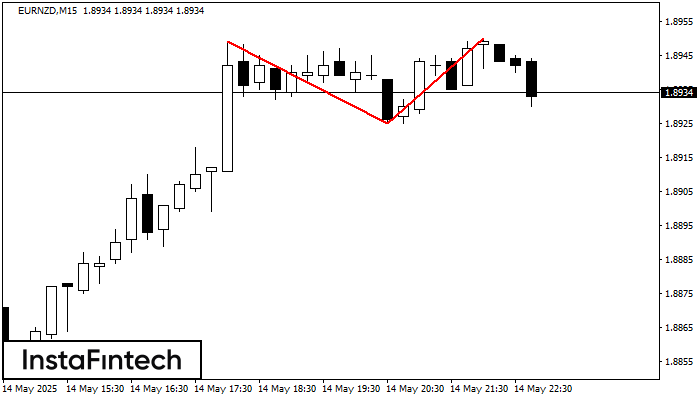
На торговом графике EURNZD M15 сформировалась разворотная фигура «Двойная вершина». Характеристика: Верхняя граница 1.8950; Нижняя граница 1.8925; Ширина фигуры 25 пунктов. Сигнал: Пробой нижней границы 1.8925 приведет к дальнейшему нисходящему
Таймфреймы М5 и М15 могут иметь больше ложных точек входа.
Открыть график инструмента в новом окне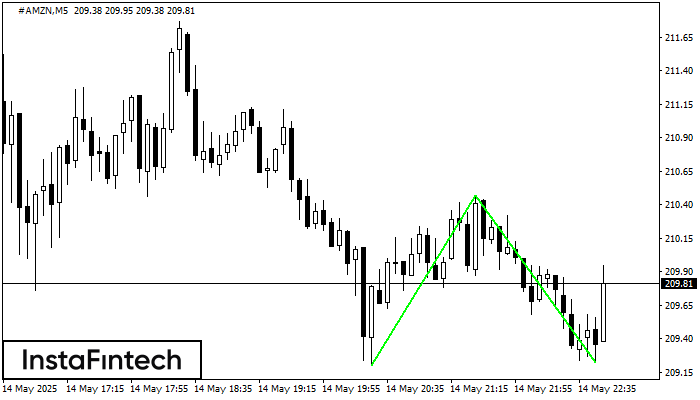
Сформирована фигура «Двойное дно» на графике #AMZN M5. Верхняя граница 210.47; Нижняя граница 209.22; Ширина фигуры 127 пунктов. В случае пробоя верхней границы 210.47 можно будет прогнозировать изменение тенденции
Таймфреймы М5 и М15 могут иметь больше ложных точек входа.
Открыть график инструмента в новом окне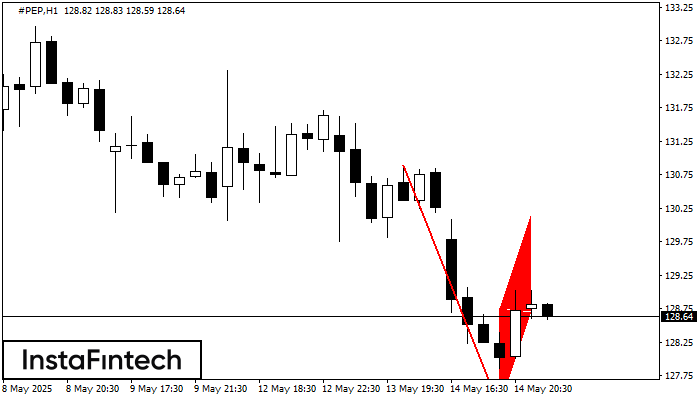
По #PEP на H1 сформировалась фигура «Медвежий флаг». Нижняя граница фигуры имеет координаты 127.29/128.71, при этом верхняя граница 128.75/130.17. Проекция высоты флагштока 360 пунктов. Формирование фигуры «Медвежий флаг» наиболее вероятным
Открыть график инструмента в новом окне


