

signal strength 3 of 5
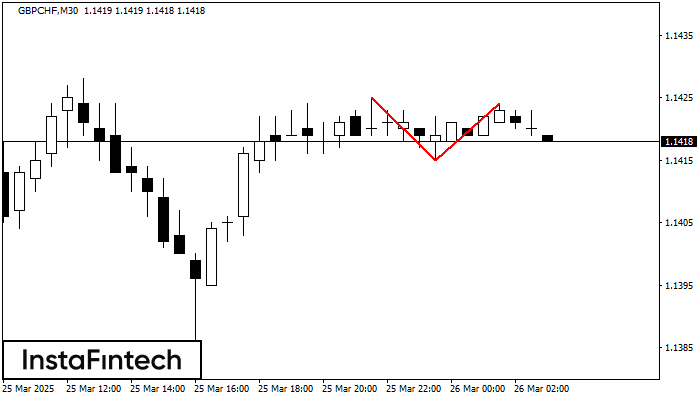
The Double Top reversal pattern has been formed on GBPCHF M30. Characteristics: the upper boundary 1.1425; the lower boundary 1.1415; the width of the pattern is 9 points. Sell trades are better to be opened below the lower boundary 1.1415 with a possible movements towards the 1.1385 level.
انظر أيضا
- All
- Double Top
- Flag
- Head and Shoulders
- Pennant
- Rectangle
- Triangle
- Triple top
- All
- #AAPL
- #AMZN
- #Bitcoin
- #EBAY
- #FB
- #GOOG
- #INTC
- #KO
- #MA
- #MCD
- #MSFT
- #NTDOY
- #PEP
- #TSLA
- #TWTR
- AUDCAD
- AUDCHF
- AUDJPY
- AUDUSD
- EURCAD
- EURCHF
- EURGBP
- EURJPY
- EURNZD
- EURRUB
- EURUSD
- GBPAUD
- GBPCHF
- GBPJPY
- GBPUSD
- GOLD
- NZDCAD
- NZDCHF
- NZDJPY
- NZDUSD
- SILVER
- USDCAD
- USDCHF
- USDJPY
- USDRUB
- All
- M5
- M15
- M30
- H1
- D1
- All
- Buy
- Sale
- All
- 1
- 2
- 3
- 4
- 5
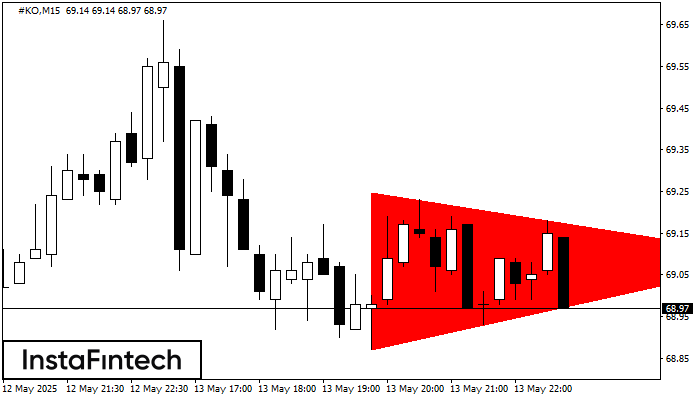
According to the chart of M15, #KO formed the Bearish Symmetrical Triangle pattern. Description: The lower border is 68.87/69.09 and upper border is 69.25/69.09. The pattern width is measured
The M5 and M15 time frames may have more false entry points.
Open chart in a new window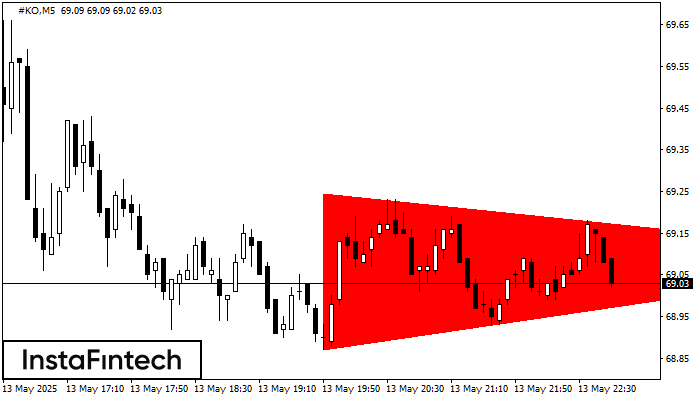
According to the chart of M5, #KO formed the Bearish Symmetrical Triangle pattern. Trading recommendations: A breach of the lower border 68.87 is likely to encourage a continuation
The M5 and M15 time frames may have more false entry points.
Open chart in a new window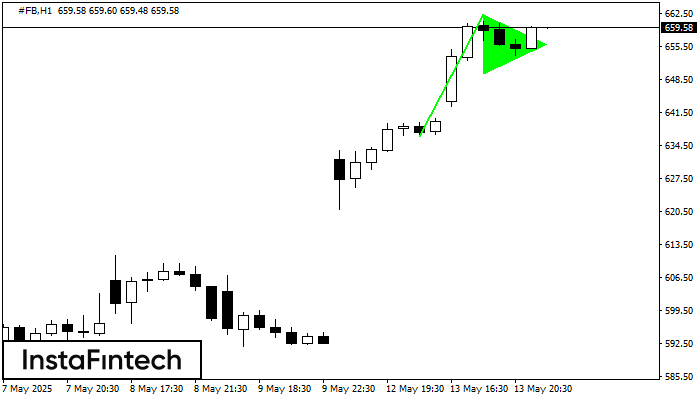
The Bullish pennant signal – Trading instrument #FB H1, continuation pattern. Forecast: it is possible to set up a buy position above the pattern’s high of 662.37, with the prospect
Open chart in a new window


