


signal strength 3 of 5
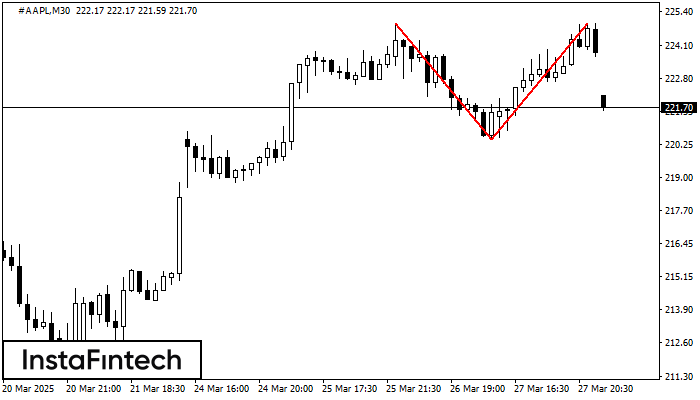
The Double Top pattern has been formed on #AAPL M30. It signals that the trend has been changed from upwards to downwards. Probably, if the base of the pattern 220.45 is broken, the downward movement will continue.
انظر أيضا
- All
- Double Top
- Flag
- Head and Shoulders
- Pennant
- Rectangle
- Triangle
- Triple top
- All
- #AAPL
- #AMZN
- #Bitcoin
- #EBAY
- #FB
- #GOOG
- #INTC
- #KO
- #MA
- #MCD
- #MSFT
- #NTDOY
- #PEP
- #TSLA
- #TWTR
- AUDCAD
- AUDCHF
- AUDJPY
- AUDUSD
- EURCAD
- EURCHF
- EURGBP
- EURJPY
- EURNZD
- EURRUB
- EURUSD
- GBPAUD
- GBPCHF
- GBPJPY
- GBPUSD
- GOLD
- NZDCAD
- NZDCHF
- NZDJPY
- NZDUSD
- SILVER
- USDCAD
- USDCHF
- USDJPY
- USDRUB
- All
- M5
- M15
- M30
- H1
- D1
- All
- Buy
- Sale
- All
- 1
- 2
- 3
- 4
- 5
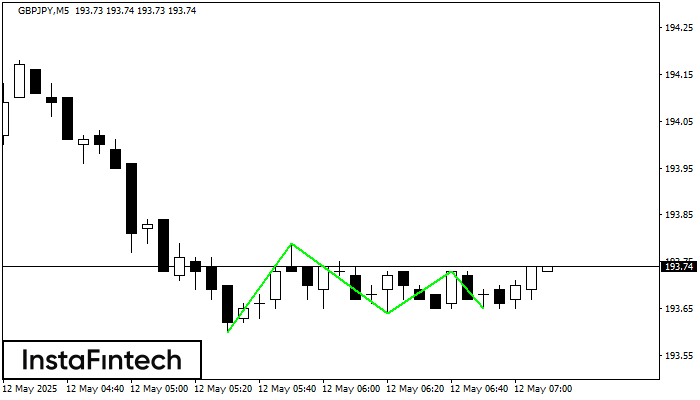
The Triple Bottom pattern has formed on the chart of GBPJPY M5. Features of the pattern: The lower line of the pattern has coordinates 193.79 with the upper limit 193.79/193.73
The M5 and M15 time frames may have more false entry points.
Open chart in a new window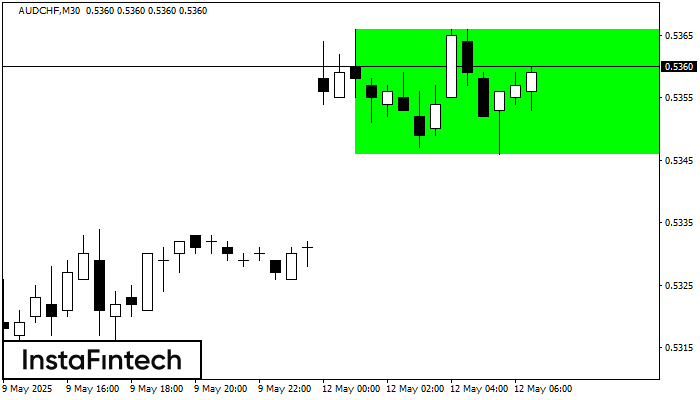
According to the chart of M30, AUDCHF formed the Bullish Rectangle. This type of a pattern indicates a trend continuation. It consists of two levels: resistance 0.5366 and support 0.5346
Open chart in a new window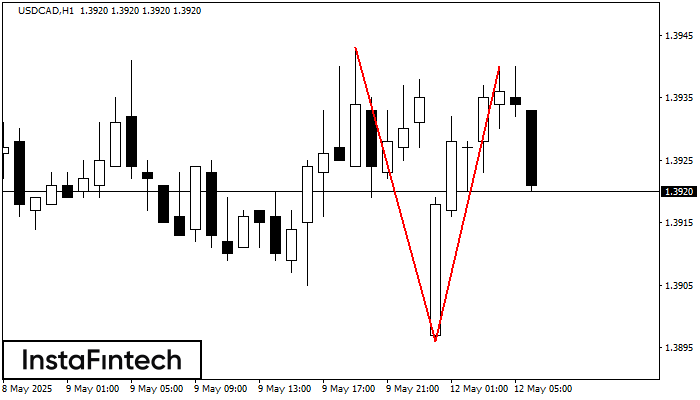
The Double Top reversal pattern has been formed on USDCAD H1. Characteristics: the upper boundary 1.3943; the lower boundary 1.3896; the width of the pattern is 44 points. Sell trades
Open chart in a new window


