


signal strength 2 of 5

The Double Bottom pattern has been formed on USDJPY M15. Characteristics: the support level 142.26; the resistance level 143.29; the width of the pattern 103 points. If the resistance level is broken, a change in the trend can be predicted with the first target point lying at the distance of 104 points.
The M5 and M15 time frames may have more false entry points.
انظر أيضا
- All
- Double Top
- Flag
- Head and Shoulders
- Pennant
- Rectangle
- Triangle
- Triple top
- All
- #AAPL
- #AMZN
- #Bitcoin
- #EBAY
- #FB
- #GOOG
- #INTC
- #KO
- #MA
- #MCD
- #MSFT
- #NTDOY
- #PEP
- #TSLA
- #TWTR
- AUDCAD
- AUDCHF
- AUDJPY
- AUDUSD
- EURCAD
- EURCHF
- EURGBP
- EURJPY
- EURNZD
- EURRUB
- EURUSD
- GBPAUD
- GBPCHF
- GBPJPY
- GBPUSD
- GOLD
- NZDCAD
- NZDCHF
- NZDJPY
- NZDUSD
- SILVER
- USDCAD
- USDCHF
- USDJPY
- USDRUB
- All
- M5
- M15
- M30
- H1
- D1
- All
- Buy
- Sale
- All
- 1
- 2
- 3
- 4
- 5
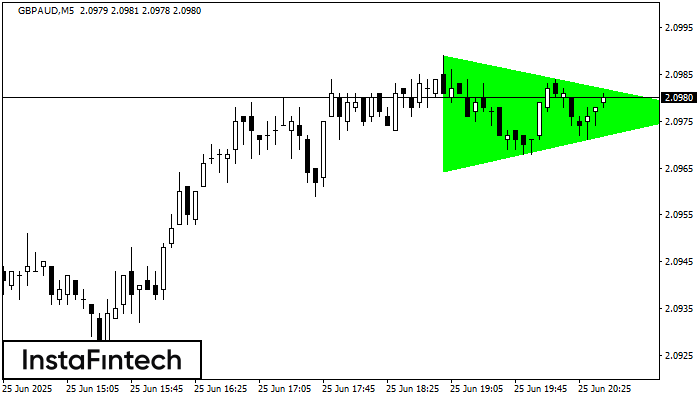
According to the chart of M5, GBPAUD formed the Bullish Symmetrical Triangle pattern, which signals the trend will continue. Description. The upper border of the pattern touches the coordinates 2.0989/2.0977
The M5 and M15 time frames may have more false entry points.
Open chart in a new window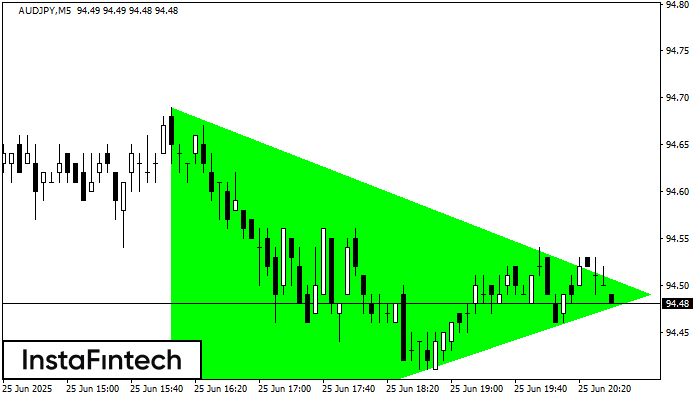
According to the chart of M5, AUDJPY formed the Bullish Symmetrical Triangle pattern. The lower border of the pattern touches the coordinates 94.32/94.49 whereas the upper border goes across 94.69/94.49
The M5 and M15 time frames may have more false entry points.
Open chart in a new window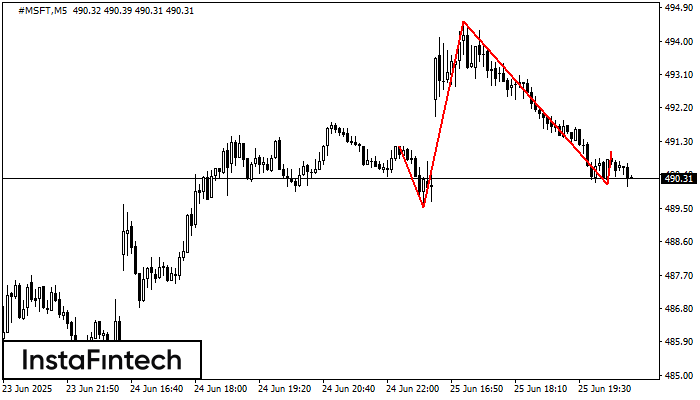
The #MSFT M5 formed the Head and Shoulders pattern with the following features: The Head’s top is at 494.52, the Neckline and the upward angle are at 489.53/490.14. The formation
The M5 and M15 time frames may have more false entry points.
Open chart in a new window


