

signal strength 4 of 5

According to the chart of H1, AUDJPY formed the Bullish Symmetrical Triangle pattern. Description: This is the pattern of a trend continuation. 91.35 and 90.50 are the coordinates of the upper and lower borders respectively. The pattern width is measured on the chart at 85 pips. Outlook: If the upper border 91.35 is broken, the price is likely to continue its move by 91.40.
انظر أيضا
- All
- Double Top
- Flag
- Head and Shoulders
- Pennant
- Rectangle
- Triangle
- Triple top
- All
- #AAPL
- #AMZN
- #Bitcoin
- #EBAY
- #FB
- #GOOG
- #INTC
- #KO
- #MA
- #MCD
- #MSFT
- #NTDOY
- #PEP
- #TSLA
- #TWTR
- AUDCAD
- AUDCHF
- AUDJPY
- AUDUSD
- EURCAD
- EURCHF
- EURGBP
- EURJPY
- EURNZD
- EURRUB
- EURUSD
- GBPAUD
- GBPCHF
- GBPJPY
- GBPUSD
- GOLD
- NZDCAD
- NZDCHF
- NZDJPY
- NZDUSD
- SILVER
- USDCAD
- USDCHF
- USDJPY
- USDRUB
- All
- M5
- M15
- M30
- H1
- D1
- All
- Buy
- Sale
- All
- 1
- 2
- 3
- 4
- 5
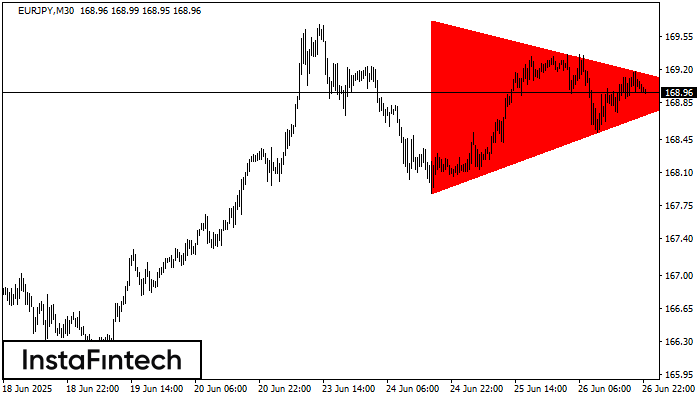
According to the chart of M30, EURJPY formed the Bearish Symmetrical Triangle pattern. This pattern signals a further downward trend in case the lower border 167.88 is breached. Here
Open chart in a new window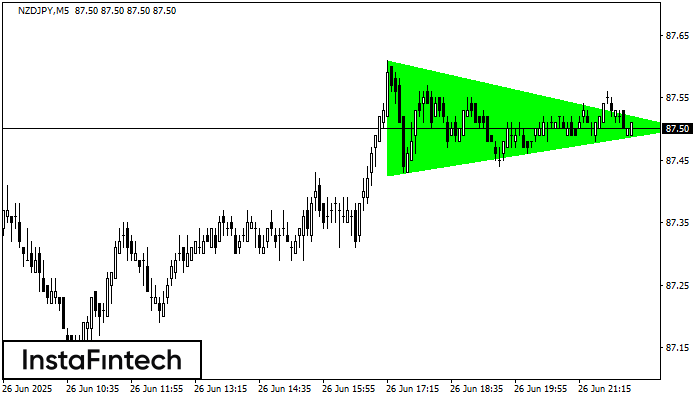
According to the chart of M5, NZDJPY formed the Bullish Symmetrical Triangle pattern, which signals the trend will continue. Description. The upper border of the pattern touches the coordinates 87.61/87.50
The M5 and M15 time frames may have more false entry points.
Open chart in a new window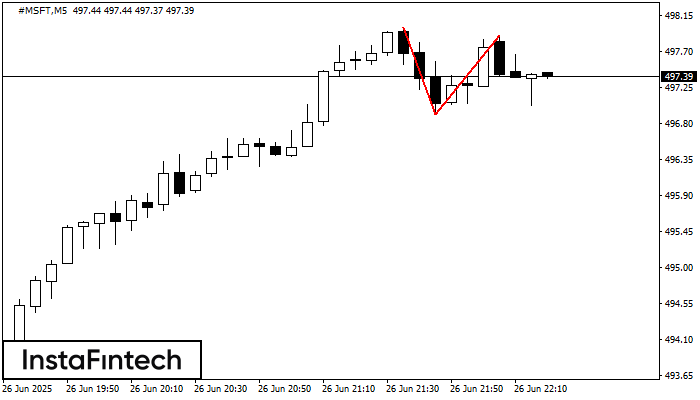
The Double Top pattern has been formed on #MSFT M5. It signals that the trend has been changed from upwards to downwards. Probably, if the base of the pattern 496.92
The M5 and M15 time frames may have more false entry points.
Open chart in a new window


