In my morning forecast, I focused on the 1.2983 level and planned to make trading decisions based on it. Looking at the 5-minute chart, we can analyze what happened. The break of 1.2983 occurred, but there was no subsequent retest, so I was left without trades. The technical outlook has been revised for the second half of the day.
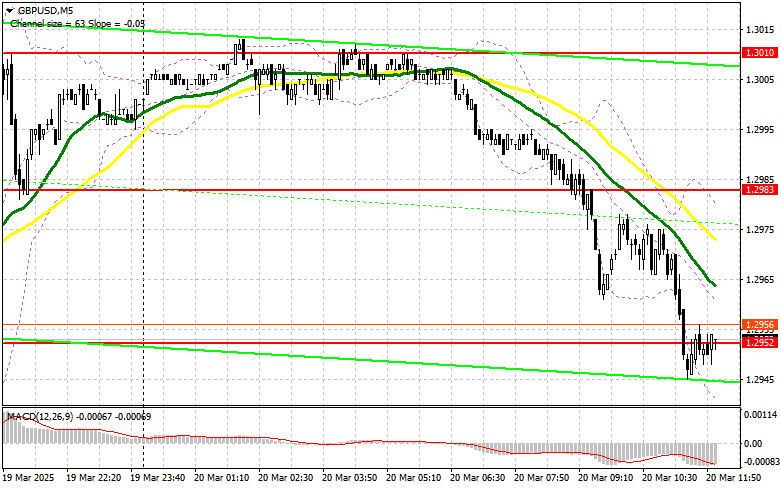
To open long positions on GBP/USD, very weak labor market data from the UK and a strong increase in jobless claims have intensified pressure on the pound ahead of the Bank of England meeting results. We already discussed trading strategies after the BoE meeting in the morning forecast, so now the focus shifts to U.S. data. We expect weekly jobless claims and the Philadelphia Fed Manufacturing Index. Strong U.S. data will further pressure the pound, leading to additional sell-offs, so it is best not to rush into buying. If there is a bearish reaction to the BoE decision and statements from Andrew Bailey, only a false breakout around 1.2926 will provide a solid entry point for long positions, aiming for a recovery towards the 1.2975 resistance level, which represents the midpoint of the sideways channel. A break and retest of this range from top to bottom would confirm another long entry, with the potential to retest 1.3010, bringing back a bullish market. The ultimate target would be 1.3056, where I plan to take profit. If GBP/USD declines and bulls fail to show activity around 1.2926, selling pressure on the pound will increase significantly, negatively impacting the pair's bullish outlook. In that case, a false breakout at 1.2876 would be an ideal setup for buying GBP/USD. I will only consider long positions on a direct rebound from 1.2841, targeting a 30–35 point correction within the day.
To open short positions on GBP/USD, the pound has dropped significantly, but the uptrend remains intact. A correction was inevitable, and profit-taking ahead of key events facilitated this move. Now, bears are focused on defending the 1.2975 resistance level, and movement towards it could occur after the BoE decision. A false breakout at 1.2975 would provide a sell entry, aiming for a decline towards 1.2926. A break and retest of this level from below would trigger stop-loss orders, opening the way towards 1.2876, marking a significant correction. The final target for short positions would be 1.2841, where I plan to take profit. A test of this level could halt the bullish market momentum. If GBP demand persists in the second half of the day and bears fail to hold 1.2975, where moving averages are also acting as resistance, then it is better to delay short positions until 1.3010. There, I will only sell after a failed consolidation. If no downward movement occurs from 1.3010, I will look for short positions on a rebound from 1.3056, targeting a 30–35 point downward correction.
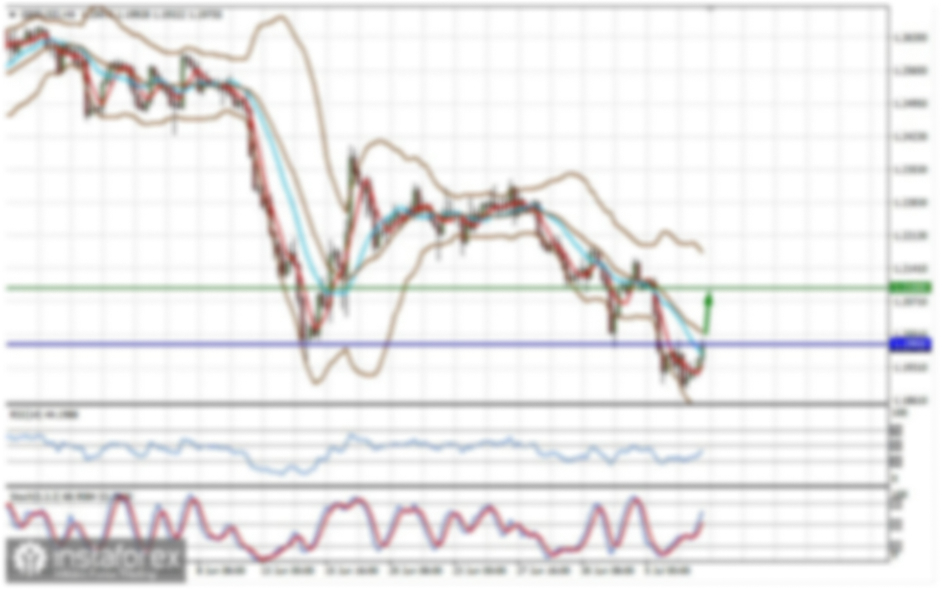
The COT report (Commitment of Traders) for March 11 showed an increase in both long and short positions, but long positions grew significantly more, making the buying bias more pronounced. This is confirmed by the GBP/USD chart. Considering the positive trends in the UK economy and the gradual approach of the Bank of England to rate cuts, GBP/USD could continue its uptrend. The upcoming Federal Reserve meeting might further weaken the dollar, so GBP buyers have little to worry about for now. However, corrections should not be ignored, as they may interrupt the market's path to new highs. The latest COT report indicates that non-commercial long positions increased by 12,920, reaching 94,786, while short positions rose by just 2,301, reaching 65,593. As a result, the gap between long and short positions expanded by 10,925.
Indicator Signals:
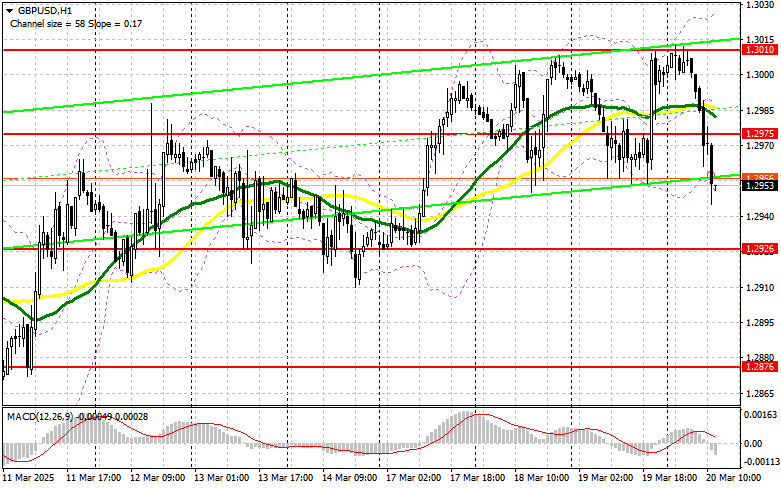
Moving Averages: Trading is occurring below the 30- and 50-day moving averages, indicating a market correction.Note: The author uses the H1 chart to analyze moving averages, which differs from their classic interpretation on the D1 chart.
Bollinger Bands: If the pair declines, support will be provided by the lower Bollinger Band at 1.2950.
Indicator Descriptions: • Moving Average (MA): Determines the current trend by smoothing volatility and noise. 50-period MA (yellow on the chart), 30-period MA (green on the chart). • MACD (Moving Average Convergence/Divergence): Fast EMA – period 12, Slow EMA – period 26, SMA – period 9. • Bollinger Bands: 20-period setting. • Non-commercial traders: Speculators such as individual traders, hedge funds, and large institutions using the futures market for speculation. • Non-commercial long positions: The total long open positions held by non-commercial traders. • Non-commercial short positions: The total short open positions held by non-commercial traders. • Non-commercial net position: The difference between short and long positions held by non-commercial traders.