

Actual patterns
Patterns are graphical models which are formed in the chart by the price. According to one of the technical analysis postulates, history (price movement) repeats itself. It means that the price movements are often similar in the same situations which makes it possible to predict the further development of the situation with a high probability.
Actual Patterns
- All
- Double Top
- Flag
- Head and Shoulders
- Pennant
- Rectangle
- Triangle
- Triple top
- All
- #AAPL
- #AMZN
- #Bitcoin
- #EBAY
- #FB
- #GOOG
- #INTC
- #KO
- #MA
- #MCD
- #MSFT
- #NTDOY
- #PEP
- #TSLA
- #TWTR
- AUDCAD
- AUDCHF
- AUDJPY
- AUDUSD
- EURCAD
- EURCHF
- EURGBP
- EURJPY
- EURNZD
- EURRUB
- EURUSD
- GBPAUD
- GBPCHF
- GBPJPY
- GBPUSD
- GOLD
- NZDCAD
- NZDCHF
- NZDJPY
- NZDUSD
- SILVER
- USDCAD
- USDCHF
- USDJPY
- USDRUB
- All
- M5
- M15
- M30
- H1
- D1
- All
- Buy
- Sale
- All
- 1
- 2
- 3
- 4
- 5
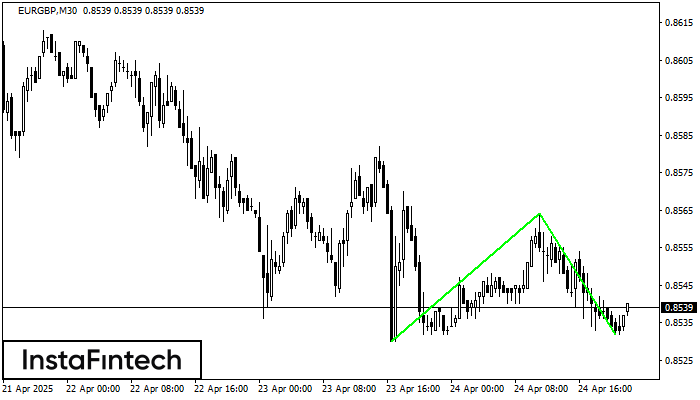
The Double Bottom pattern has been formed on EURGBP M30. This formation signals a reversal of the trend from downwards to upwards. The signal is that a buy trade should
Open chart in a new window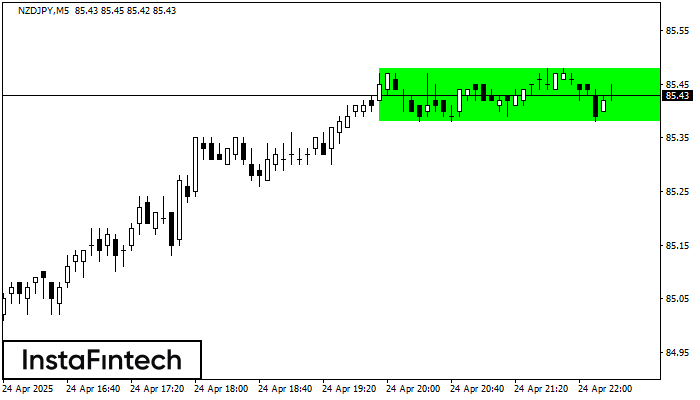
According to the chart of M5, NZDJPY formed the Bullish Rectangle. The pattern indicates a trend continuation. The upper border is 85.48, the lower border is 85.38. The signal means
The M5 and M15 time frames may have more false entry points.
Open chart in a new window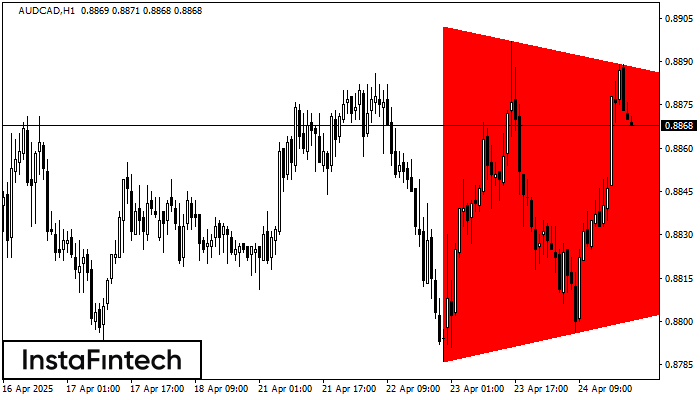
According to the chart of H1, AUDCAD formed the Bearish Symmetrical Triangle pattern. Trading recommendations: A breach of the lower border 0.8786 is likely to encourage a continuation
Open chart in a new window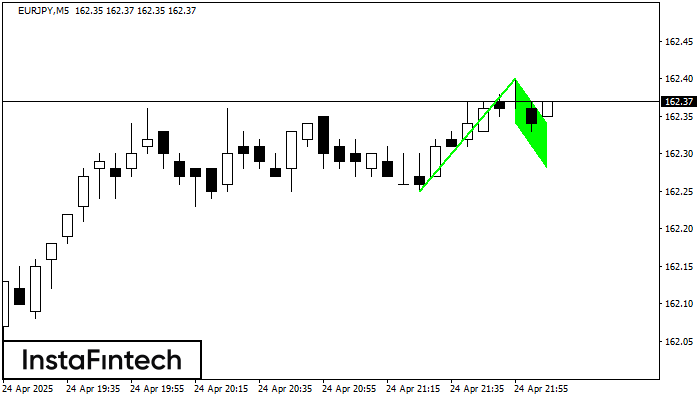
The Bullish Flag pattern which signals continuation of a trend has been formed on the chart EURJPY M5. Forecast: if the price breaks above the pattern high at 162.40, then
The M5 and M15 time frames may have more false entry points.
Open chart in a new window
The Bullish pennant graphic pattern has formed on the EURJPY M5 instrument. This pattern type falls under the category of continuation patterns. In this case, if the quote can breaks
The M5 and M15 time frames may have more false entry points.
Open chart in a new window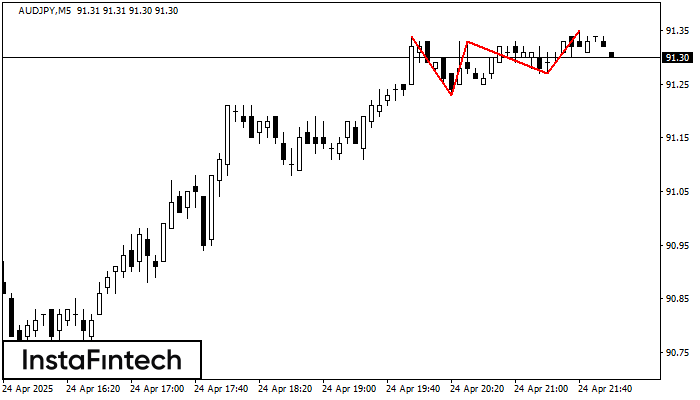
The Triple Top pattern has formed on the chart of the AUDJPY M5. Features of the pattern: borders have an ascending angle; the lower line of the pattern
The M5 and M15 time frames may have more false entry points.
Open chart in a new window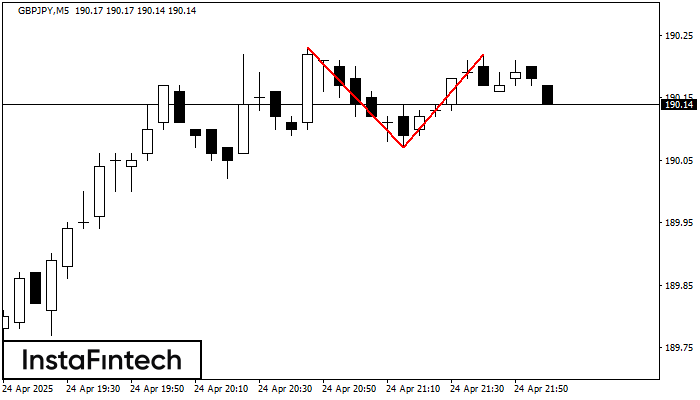
The Double Top pattern has been formed on GBPJPY M5. It signals that the trend has been changed from upwards to downwards. Probably, if the base of the pattern 190.07
The M5 and M15 time frames may have more false entry points.
Open chart in a new window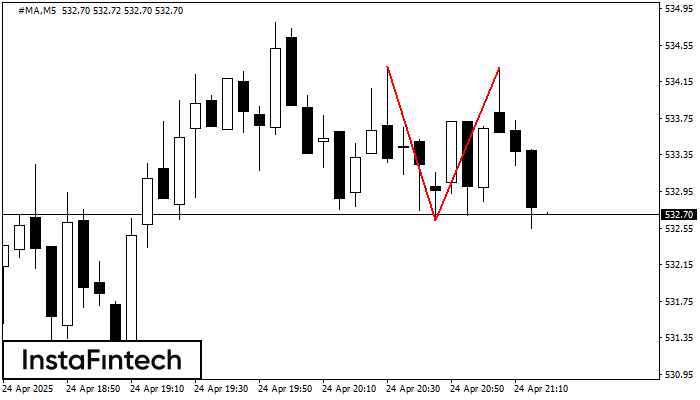
The Double Top reversal pattern has been formed on #MA M5. Characteristics: the upper boundary 534.32; the lower boundary 532.63; the width of the pattern is 168 points. Sell trades
The M5 and M15 time frames may have more false entry points.
Open chart in a new window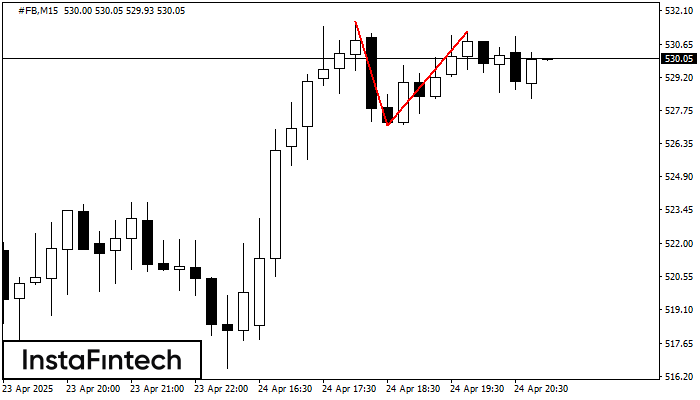
On the chart of #FB M15 the Double Top reversal pattern has been formed. Characteristics: the upper boundary 531.20; the lower boundary 527.14; the width of the pattern 406 points
The M5 and M15 time frames may have more false entry points.
Open chart in a new window


