

signal strength 2 of 5
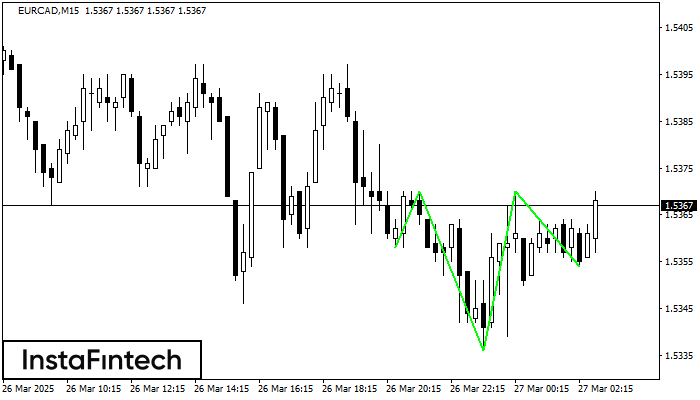
According to the chart of M15, EURCAD formed the Inverse Head and Shoulder pattern. The Head’s top is set at 1.5370 while the median line of the Neck is found at 1.5336/1.5354. The formation of the Inverse Head and Shoulder pattern evidently signals a reversal of the downward trend. In other words, in case the scenario comes true, the price of EURCAD will go towards 1.5393
The M5 and M15 time frames may have more false entry points.
See Also
- All
- Double Top
- Flag
- Head and Shoulders
- Pennant
- Rectangle
- Triangle
- Triple top
- All
- #AAPL
- #AMZN
- #Bitcoin
- #EBAY
- #FB
- #GOOG
- #INTC
- #KO
- #MA
- #MCD
- #MSFT
- #NTDOY
- #PEP
- #TSLA
- #TWTR
- AUDCAD
- AUDCHF
- AUDJPY
- AUDUSD
- EURCAD
- EURCHF
- EURGBP
- EURJPY
- EURNZD
- EURRUB
- EURUSD
- GBPAUD
- GBPCHF
- GBPJPY
- GBPUSD
- GOLD
- NZDCAD
- NZDCHF
- NZDJPY
- NZDUSD
- SILVER
- USDCAD
- USDCHF
- USDJPY
- USDRUB
- All
- M5
- M15
- M30
- H1
- D1
- All
- Buy
- Sale
- All
- 1
- 2
- 3
- 4
- 5
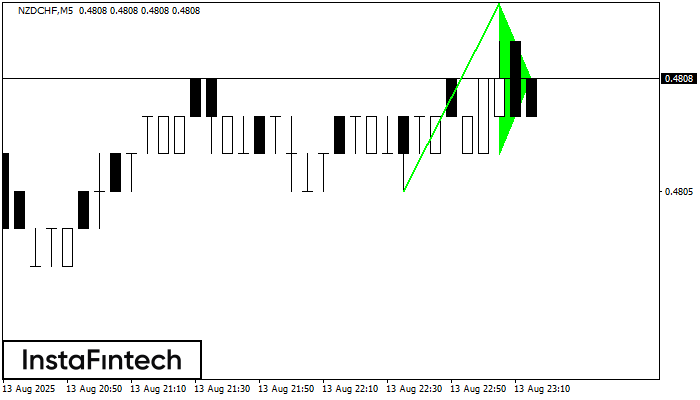
На графике NZDCHF M5 сформировался паттерн «Бычий вымпел», который относится к фигуре продолжения тренда. Можно предполагать, что, в случае фиксации цены выше максимума вымпела 0.4810, возможно дальнейшее восходящее движение
Таймфреймы М5 и М15 могут иметь больше ложных точек входа.
Открыть график инструмента в новом окне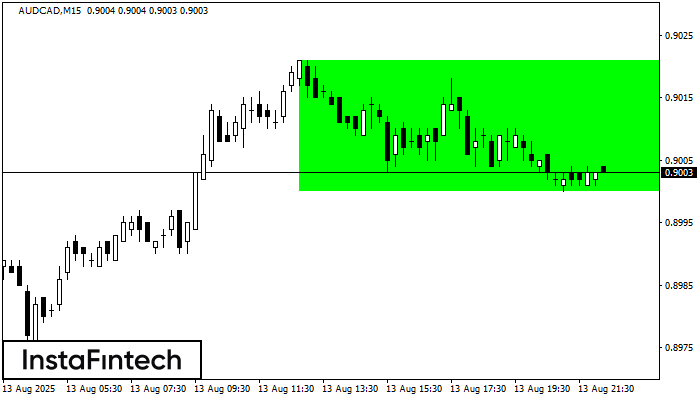
По торговому инструменту AUDCAD на M15 сформировалась фигура продолжения тренда - «Прямоугольник». Фигура имеет границы: Нижняя 0.9000; Верхняя 0.9021. В случае пробоя верхней границы вероятно дальнейшее движение в сторону тренда
Таймфреймы М5 и М15 могут иметь больше ложных точек входа.
Открыть график инструмента в новом окне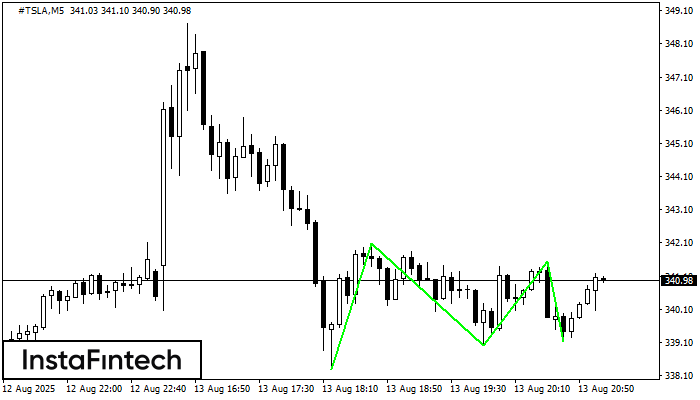
По торговому инструменту #TSLA на M5 была сформирована графическая фигура «Тройное дно» с характеристиками: Уровень сопротивления 341.55; Уровень поддержки 339.14; Ширина 241 пунктов. В случае пробоя уровня сопротивления 342.09 котировка
Таймфреймы М5 и М15 могут иметь больше ложных точек входа.
Открыть график инструмента в новом окне


