


signal strength 1 of 5
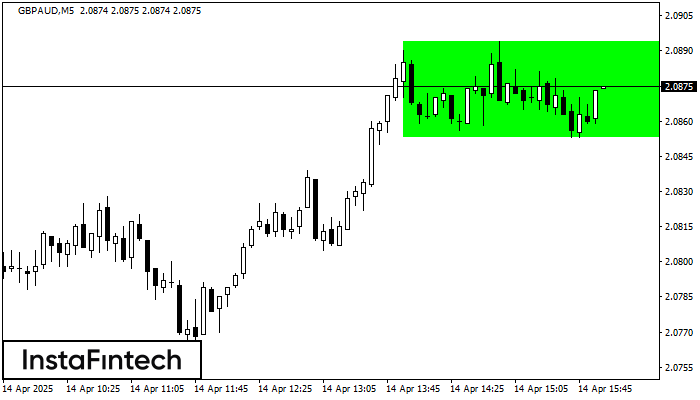
According to the chart of M5, GBPAUD formed the Bullish Rectangle. This type of a pattern indicates a trend continuation. It consists of two levels: resistance 2.0894 and support 2.0853. In case the resistance level 2.0894 - 2.0894 is broken, the instrument is likely to follow the bullish trend.
The M5 and M15 time frames may have more false entry points.
See Also
- All
- Double Top
- Flag
- Head and Shoulders
- Pennant
- Rectangle
- Triangle
- Triple top
- All
- #AAPL
- #AMZN
- #Bitcoin
- #EBAY
- #FB
- #GOOG
- #INTC
- #KO
- #MA
- #MCD
- #MSFT
- #NTDOY
- #PEP
- #TSLA
- #TWTR
- AUDCAD
- AUDCHF
- AUDJPY
- AUDUSD
- EURCAD
- EURCHF
- EURGBP
- EURJPY
- EURNZD
- EURRUB
- EURUSD
- GBPAUD
- GBPCHF
- GBPJPY
- GBPUSD
- GOLD
- NZDCAD
- NZDCHF
- NZDJPY
- NZDUSD
- SILVER
- USDCAD
- USDCHF
- USDJPY
- USDRUB
- All
- M5
- M15
- M30
- H1
- D1
- All
- Buy
- Sale
- All
- 1
- 2
- 3
- 4
- 5

M5 এর চার্ট অনুযায়ী, #Bitcoin বিয়ারিশ সিমেট্রিক্যাল ট্রায়াঙ্গেল প্যাটার্ন গঠন করেছে। ট্রেডিংয়ের পরামর্শ: 107810.44 এর নীচের সীমানা লঙ্ঘন করা হলে নিম্নমুখী প্রবণতা অব্যাহত রাখতে উৎসাহিত করবে।
M5 এবং M15 টাইম ফ্রেমে আরও ভুল এন্ট্রি পয়েন্ট থাকতে পারে।
Open chart in a new window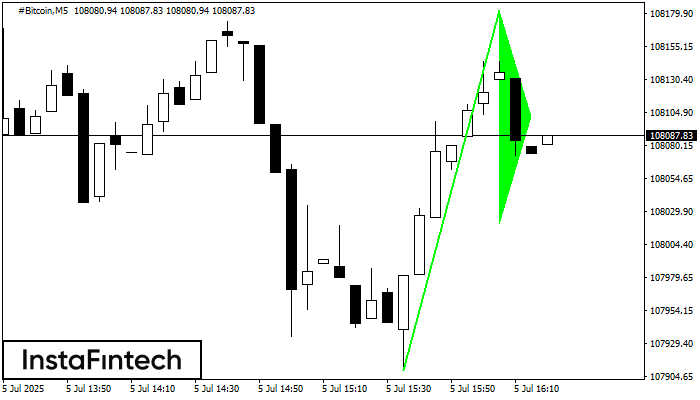
বুলিশ পেন্যান্ট সংকেত – M5 -এ #Bitcoin ট্রেডিং ইন্সট্রুমেন্টের ধারাবাহিকতার প্যাটার্ন। পূর্বাভাস: প্যাটার্নের সর্বোচ্চ 108182.82 এর উপরে বাই পজিশন নির্ধারণ করা সম্ভব, পরবর্তী পদক্ষেপে ফ্ল্যাগপোলের উচ্চতার একটি প্রজেকশনের সম্ভাবনা রয়েছে।
M5 এবং M15 টাইম ফ্রেমে আরও ভুল এন্ট্রি পয়েন্ট থাকতে পারে।
Open chart in a new window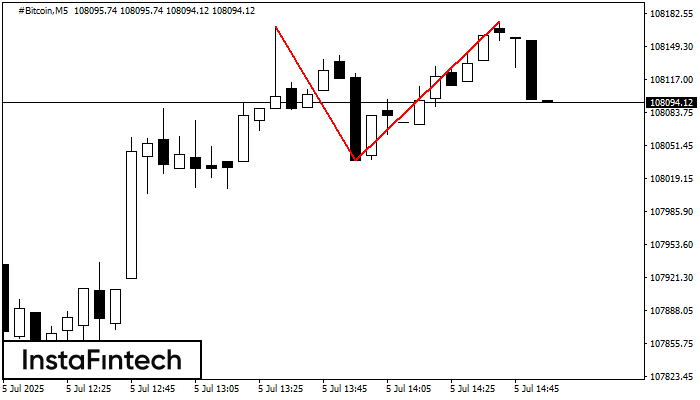
M5 চার্টে, #Bitcoin-এর ডাবল টপ প্যাটার্নটি গঠিত হয়েছে। এটি এই ইঙ্গিত দেয় যে চলমান প্রবণতা ঊর্ধ্বমুখী থেকে নিম্নমুখীতে পরিবর্তিত হয়েছে। সম্ভবত, যদি 108036.85 প্যাটার্নের ভিত্তিটি ব্রেক করা হয়, তাহলে নিম্নমুখী
M5 এবং M15 টাইম ফ্রেমে আরও ভুল এন্ট্রি পয়েন্ট থাকতে পারে।
Open chart in a new window


