


signal strength 1 of 5
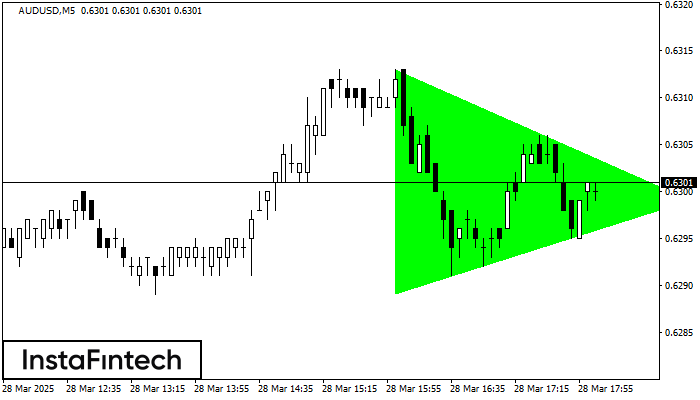
According to the chart of M5, AUDUSD formed the Bullish Symmetrical Triangle pattern, which signals the trend will continue. Description. The upper border of the pattern touches the coordinates 0.6313/0.6299 whereas the lower border goes across 0.6289/0.6299. The pattern width is measured on the chart at 24 pips. If the Bullish Symmetrical Triangle pattern is in progress during the upward trend, this indicates the current trend will go on. In case 0.6299 is broken, the price could continue its move toward 0.6314.
The M5 and M15 time frames may have more false entry points.
See Also
- All
- Double Top
- Flag
- Head and Shoulders
- Pennant
- Rectangle
- Triangle
- Triple top
- All
- #AAPL
- #AMZN
- #Bitcoin
- #EBAY
- #FB
- #GOOG
- #INTC
- #KO
- #MA
- #MCD
- #MSFT
- #NTDOY
- #PEP
- #TSLA
- #TWTR
- AUDCAD
- AUDCHF
- AUDJPY
- AUDUSD
- EURCAD
- EURCHF
- EURGBP
- EURJPY
- EURNZD
- EURRUB
- EURUSD
- GBPAUD
- GBPCHF
- GBPJPY
- GBPUSD
- GOLD
- NZDCAD
- NZDCHF
- NZDJPY
- NZDUSD
- SILVER
- USDCAD
- USDCHF
- USDJPY
- USDRUB
- All
- M5
- M15
- M30
- H1
- D1
- All
- Buy
- Sale
- All
- 1
- 2
- 3
- 4
- 5
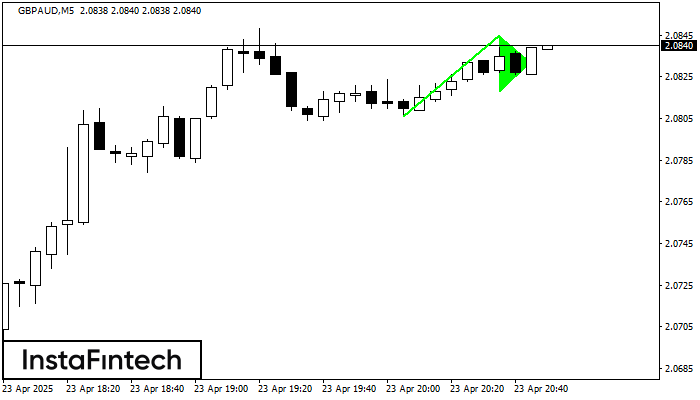
Isyarat Pennant Aliran Menaik – Instrumen dagangan GBPAUD M5, corak kesinambungan. Ramalan: adalah mungkin untuk menetapkan kedudukan membeli di atas paras tinggi corak 2.0845, dengan prospek pergerakan seterusnya menjadi unjuran
Carta masa M5 dan M15 mungkin mempunyai lebih banyak titik kemasukan palsu.
Open chart in a new window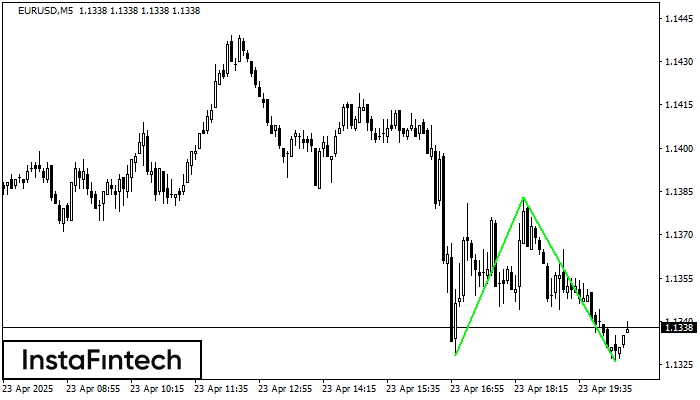
Corak Double Bottom telah dibentuk pada EURUSD M5. Pembentukan ini menandakan pembalikan aliran dari aliran menurun ke atas. Isyarat ialah perdagangan membeli harus dibuka selepas sempadan atas corak 1.1383 telah
Carta masa M5 dan M15 mungkin mempunyai lebih banyak titik kemasukan palsu.
Open chart in a new window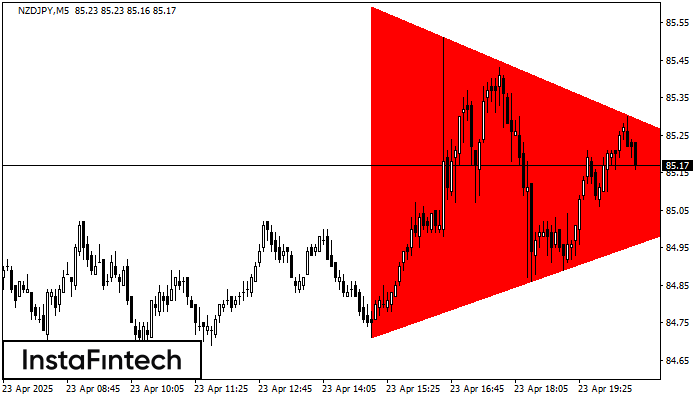
Berdasarkan carta M5, NZDJPY membentuk corak Segi Tiga Simetri Menurun. Cadangan dagangan: Penembusan sempadan bawah 84.71 mungkin mendorong kepada kesinambungan aliran menurun
Carta masa M5 dan M15 mungkin mempunyai lebih banyak titik kemasukan palsu.
Open chart in a new window


