

signal strength 1 of 5
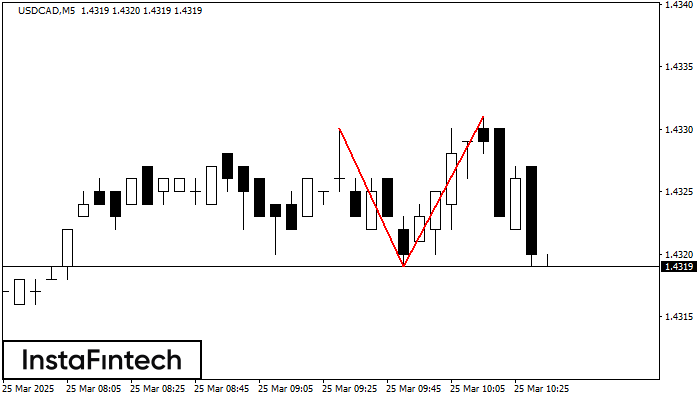
On the chart of USDCAD M5 the Double Top reversal pattern has been formed. Characteristics: the upper boundary 1.4331; the lower boundary 1.4319; the width of the pattern 12 points. The signal: a break of the lower boundary will cause continuation of the downward trend targeting the 1.4304 level.
The M5 and M15 time frames may have more false entry points.
- All
- Double Top
- Flag
- Head and Shoulders
- Pennant
- Rectangle
- Triangle
- Triple top
- All
- #AAPL
- #AMZN
- #Bitcoin
- #EBAY
- #FB
- #GOOG
- #INTC
- #KO
- #MA
- #MCD
- #MSFT
- #NTDOY
- #PEP
- #TSLA
- #TWTR
- AUDCAD
- AUDCHF
- AUDJPY
- AUDUSD
- EURCAD
- EURCHF
- EURGBP
- EURJPY
- EURNZD
- EURRUB
- EURUSD
- GBPAUD
- GBPCHF
- GBPJPY
- GBPUSD
- GOLD
- NZDCAD
- NZDCHF
- NZDJPY
- NZDUSD
- SILVER
- USDCAD
- USDCHF
- USDJPY
- USDRUB
- All
- M5
- M15
- M30
- H1
- D1
- All
- Buy
- Sale
- All
- 1
- 2
- 3
- 4
- 5
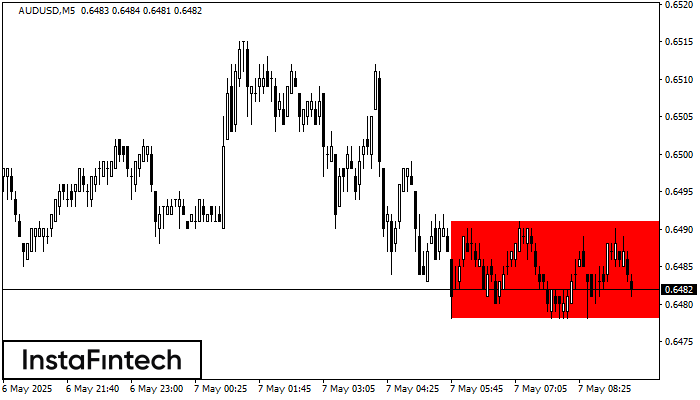
Сформирована фигура «Прямоугольник» на графике AUDUSD M5. Тип фигуры: Продолжение тренда; Границы: Верхняя 0.6491, Нижняя 0.6478; Сигнал: позиция на продажу открывается после фиксации цены ниже границы прямоугольника 0.6478
Таймфреймы М5 и М15 могут иметь больше ложных точек входа.
Открыть график инструмента в новом окне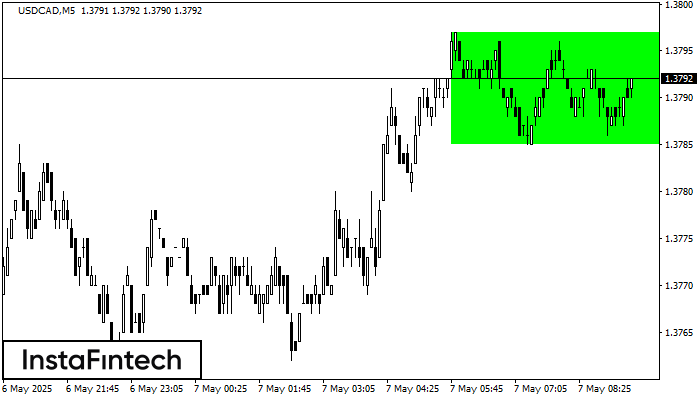
Сформирована фигура «Прямоугольник» на графике USDCAD M5. Тип фигуры: Продолжение тренда; Границы: Верхняя 1.3797, Нижняя 1.3785; Сигнал: позицию на покупку следует открывать выше верхней границы прямоугольника 1.3797
Таймфреймы М5 и М15 могут иметь больше ложных точек входа.
Открыть график инструмента в новом окне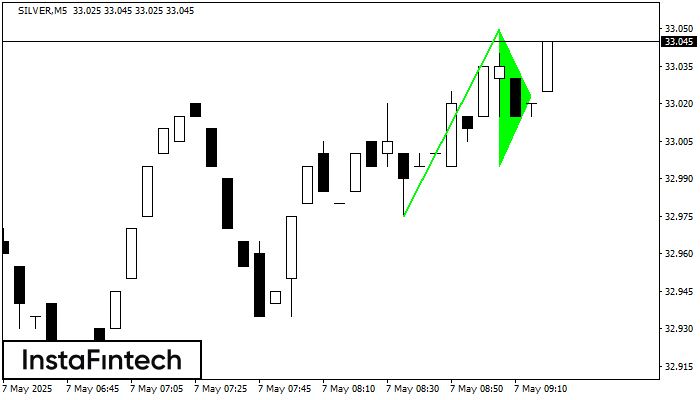
Графическая фигура «Бычий вымпел» сформировалась по инструменту SILVER на M5. Данный вид фигуры относится к типу продолжения тенденции. В случае если котировке удастся преодолеть максимум вымпела 33.05, то ожидается продолжение
Таймфреймы М5 и М15 могут иметь больше ложных точек входа.
Открыть график инструмента в новом окне


