


signal strength 1 of 5
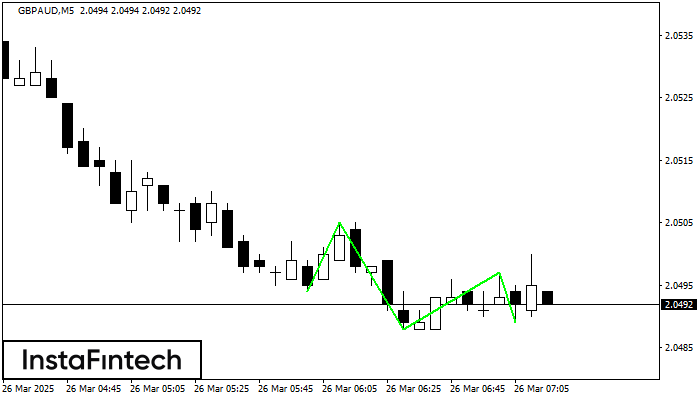
The Triple Bottom pattern has formed on the chart of GBPAUD M5. Features of the pattern: The lower line of the pattern has coordinates 2.0505 with the upper limit 2.0505/2.0497, the projection of the width is 11 points. The formation of the Triple Bottom pattern most likely indicates a change in the trend from downward to upward. This means that in the event of a breakdown of the resistance level 2.0494, the price is most likely to continue the upward movement.
The M5 and M15 time frames may have more false entry points.
See Also
- All
- Double Top
- Flag
- Head and Shoulders
- Pennant
- Rectangle
- Triangle
- Triple top
- All
- #AAPL
- #AMZN
- #Bitcoin
- #EBAY
- #FB
- #GOOG
- #INTC
- #KO
- #MA
- #MCD
- #MSFT
- #NTDOY
- #PEP
- #TSLA
- #TWTR
- AUDCAD
- AUDCHF
- AUDJPY
- AUDUSD
- EURCAD
- EURCHF
- EURGBP
- EURJPY
- EURNZD
- EURRUB
- EURUSD
- GBPAUD
- GBPCHF
- GBPJPY
- GBPUSD
- GOLD
- NZDCAD
- NZDCHF
- NZDJPY
- NZDUSD
- SILVER
- USDCAD
- USDCHF
- USDJPY
- USDRUB
- All
- M5
- M15
- M30
- H1
- D1
- All
- Buy
- Sale
- All
- 1
- 2
- 3
- 4
- 5
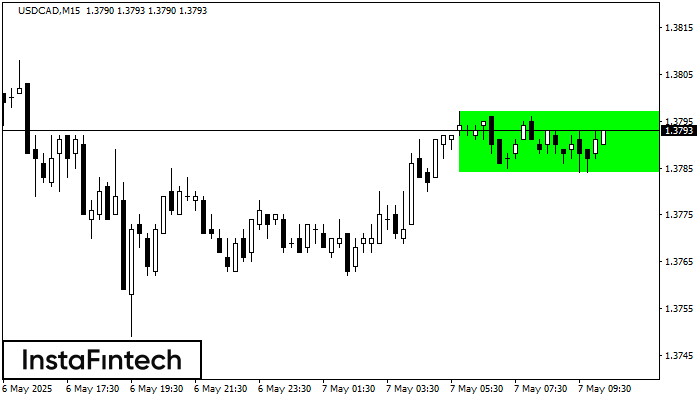
M15 চার্ট অনুযায়ী, USDCAD বুলিশ রেক্ট্যাঙ্গেল গঠন করেছে। এই প্যাটার্ন এই ধরনের প্রবণতার ধারাবাহিকতার নির্দেশ করে. এটি দুটি স্তর নিয়ে গঠিত: 1.3797 -এর রেজিস্ট্যান্স এবং 1.3784 -এর সাপোর্ট৷ রেজিস্ট্যান্স স্তর
M5 এবং M15 টাইম ফ্রেমে আরও ভুল এন্ট্রি পয়েন্ট থাকতে পারে।
Open chart in a new window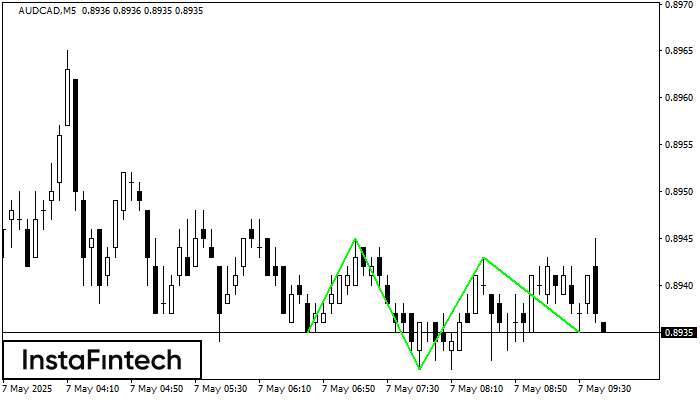
M5 চার্ট অনুযায়ী, AUDCAD-এর ইনভার্স হেড অ্যান্ড শোল্ডার্স প্যাটার্ন গঠিত হয়েছে। হেড 0.8931 -এ নির্ধারণ করা হয়েছে এবং নেকের মিডিয়ান লাইন 0.8945/0.8943 -এ নির্ধারণ করা হয়েছে। ইনভার্স হেড অ্যান্ড শোল্ডার্স
M5 এবং M15 টাইম ফ্রেমে আরও ভুল এন্ট্রি পয়েন্ট থাকতে পারে।
Open chart in a new window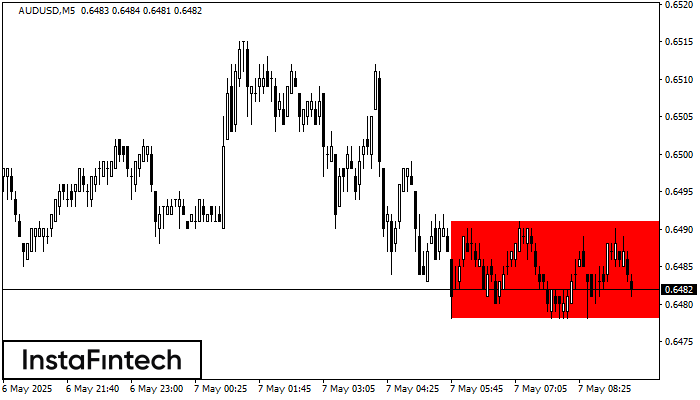
M5 চার্ট অনুযায়ী, AUDUSD বিয়ারিশ রেক্ট্যাঙ্গেল গঠন করেছে। এই প্যাটার্ন চলমান প্রবণতার ধারাবাহিকতা নির্দেশ করে। উপরের সীমানা হল 0.6491, নীচের সীমানা হল 0.6478৷ এই সংকেতের অর্থ হল বিয়ারিশ রেক্ট্যাঙ্গেল-এর নীচের
M5 এবং M15 টাইম ফ্রেমে আরও ভুল এন্ট্রি পয়েন্ট থাকতে পারে।
Open chart in a new window


