


signal strength 1 of 5
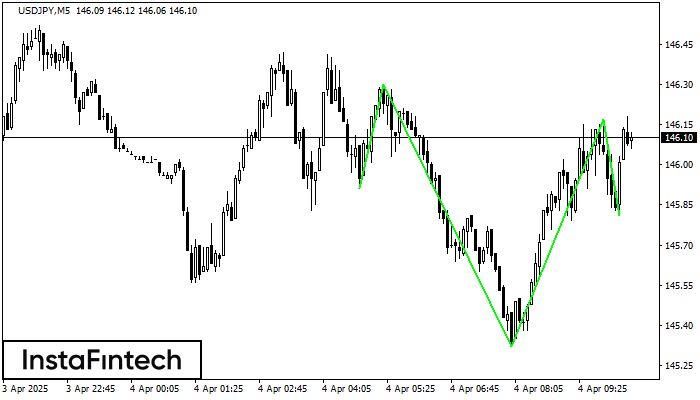
According to M5, USDJPY is shaping the technical pattern – the Inverse Head and Shoulder. In case the Neckline 146.30/146.17 is broken out, the instrument is likely to move toward 146.32.
The M5 and M15 time frames may have more false entry points.
- All
- Double Top
- Flag
- Head and Shoulders
- Pennant
- Rectangle
- Triangle
- Triple top
- All
- #AAPL
- #AMZN
- #Bitcoin
- #EBAY
- #FB
- #GOOG
- #INTC
- #KO
- #MA
- #MCD
- #MSFT
- #NTDOY
- #PEP
- #TSLA
- #TWTR
- AUDCAD
- AUDCHF
- AUDJPY
- AUDUSD
- EURCAD
- EURCHF
- EURGBP
- EURJPY
- EURNZD
- EURRUB
- EURUSD
- GBPAUD
- GBPCHF
- GBPJPY
- GBPUSD
- GOLD
- NZDCAD
- NZDCHF
- NZDJPY
- NZDUSD
- SILVER
- USDCAD
- USDCHF
- USDJPY
- USDRUB
- All
- M5
- M15
- M30
- H1
- D1
- All
- Buy
- Sale
- All
- 1
- 2
- 3
- 4
- 5
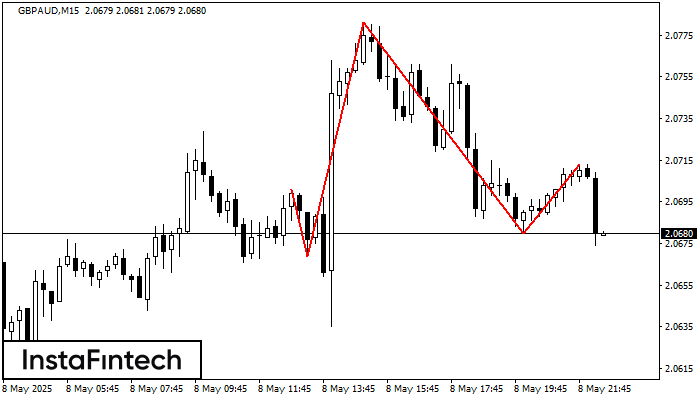
The technical pattern called Head and Shoulders has appeared on the chart of GBPAUD M15. There are weighty reasons to suggest that the price will surpass the Neckline 2.0669/2.0680 after
The M5 and M15 time frames may have more false entry points.
Open chart in a new window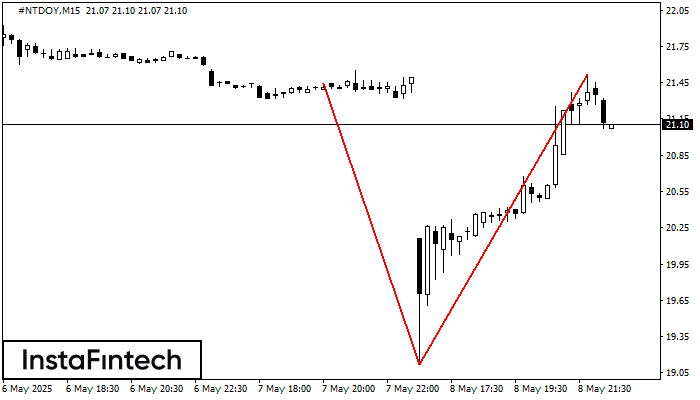
The Double Top pattern has been formed on #NTDOY M15. It signals that the trend has been changed from upwards to downwards. Probably, if the base of the pattern 19.12
The M5 and M15 time frames may have more false entry points.
Open chart in a new window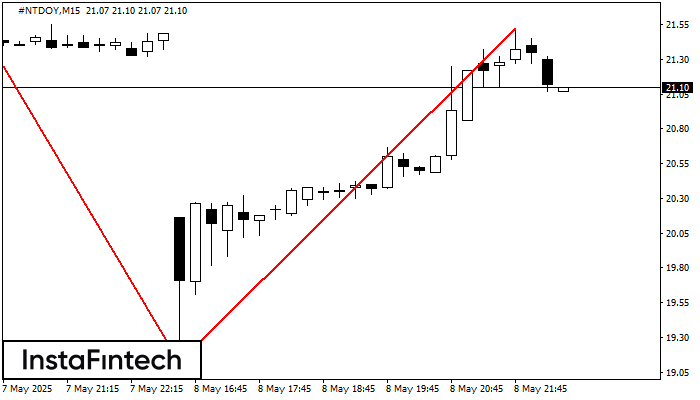
The Double Top reversal pattern has been formed on #NTDOY M15. Characteristics: the upper boundary 21.44; the lower boundary 19.12; the width of the pattern is 240 points. Sell trades
The M5 and M15 time frames may have more false entry points.
Open chart in a new window


