Nvidia's Earnings Soar on AI Wave: A Look at the Tech Giant's Breakthrough Year
Key Takeaways:
- Nvidia's recent financial results have surpassed expectations, pushing its market valuation even higher.
- AI and data center revenues show exceptional growth, highlighting Nvidia's pivotal role in the AI revolution.
- Despite the impressive performance, there is caution over the sustainability of Nvidia's stock growth due to its already massive market capitalization.
A Technological and Financial Breakthrough:
The Wall Street spotlight has been firmly on Nvidia (NVDA) for weeks, culminating in an earnings report that not only shattered market expectations but also propelled the company's shares up by nearly 8% post-market. This surge has had a knock-on effect on other tech stocks like AMD and SuperMicro Computers. Nvidia's CEO, Jensen Huang, has dubbed generative artificial intelligence a "real inflection point" and a "breakthrough technology," a statement justified by the company's robust earnings.
Earnings Highlights:
- Revenue for Q4 2023: $22.1 billion versus predictions of $20.41 billion.
- Non-GAAP EPS: $5.16 (GAAP $4.93) against forecasts of $4.63.
- Data center revenue: $18.48 billion, over the $17.21 billion expected.
- Gaming revenue: $2.98 billion compared to the anticipated $2.72 billion.
- Automotive solutions revenue: $281 million, slightly above the $272.1 million forecast.
- Professional visualization revenue: $463 million versus $435.5 million expected.
- Gross margin stood at an impressive 76.7%, compared to the 75.4% predicted.
- R&D spending rose to $2.47 billion, indicating a 26% year-over-year increase.
Forward-Looking Statements:
Nvidia's projection for Q1 2024 is a staggering $24.8 billion in revenue, far outstripping Wall Street's estimates of $21.9 billion. The company has bought back $9.2 billion of its own shares, reflecting confidence in its future.
The AI Revolution Catalyst:
Nvidia's partnership with Google to deliver the Gamma series of models, utilizing RTX GPUs, underscores its commitment to driving growth in AI. The report points to a nearly 800% year-over-year increase in free cash flow, underscoring the massive upswing in Nvidia's operations. The data center segment, in particular, saw record revenues, thanks to increased shipments of Nvidia's Hopper GPU platforms for large language models and generative AI applications.
Market Dynamics:
Despite Nvidia's remarkable financials, there's a note of caution among investors. With a market cap already exceeding $1.6 trillion, expectations for continued exponential stock growth must be tempered. The extraordinary year of 2023 has set a high bar for Nvidia, and while the AI revolution is far from over, excessive optimism may lead to disappointment if future quarters don't keep pace with the high expectations.
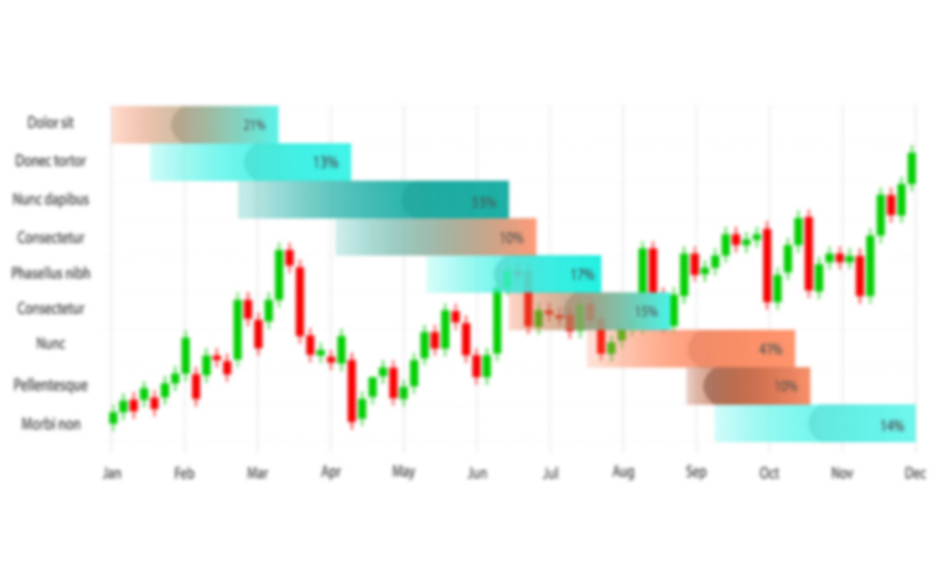
Technical Analysis:
Looking at Nvidia's stock chart, the price action has been on a strong uptrend, with the latest earnings release causing a significant price gap. The stock is trading well above its 100-day and 200-day exponential moving averages (EMAs), a bullish sign. However, the Relative Strength Index (RSI) suggests that the stock is currently in overbought territory, which may indicate a potential pullback or consolidation in the near term.
- Trend Analysis:
- The stock has been in a significant uptrend, as indicated by the higher highs and higher lows. The price is also trading above the 100-day and 200-day Exponential Moving Averages (EMAs), which is a bullish signal.
- Moving Averages:
- The 50-day Double Exponential Moving Average (DEMA) is above the 100-day EMA, and both are below the current price, suggesting a strong uptrend.
- The 200-day EMA is also well below the current price, further confirming the bullish trend.
- Momentum Indicators:
- The Relative Strength Index (RSI) is at 73.52, which is above the overbought threshold of 70. This suggests that the stock might be overextended in the short term and could be due for a pullback or consolidation.
- Price Action:
- The stock has recently made a new high, which is a sign of strength. However, given the overbought RSI, this could also indicate potential for a short-term reversal or pause in the trend.
- Potential Support/Resistance:
- Potential resistance might be forming at the recent high, as traders who bought at lower prices could take profits.
- On the downside, the previous resistance levels, which are not marked but can be inferred from previous price peaks, might turn into support levels.
Summary: NVIDIA's stock shows a strong bullish trend with the price trading above key moving averages. The overbought RSI suggests caution as there might be a pullback or consolidation in the near term. Traders might look for potential entry points on any pullbacks towards support levels or moving averages.
Traffic Light Indicator:
- Green: The overall trend is positive with price trading above major moving averages.
- Amber: The high RSI reading signals that the stock may be overbought, suggesting caution.
- Red: A reversal signal could be given if the RSI turns down sharply or if the price breaks below a significant moving average or support level.
Traders should monitor the price action closely, especially since the RSI is indicating that the stock is in the overbought territory. Any signs of weakness could prompt a short-term retracement.
Investing in Nvidia: A Balancing Act
Investors are urged to weigh Nvidia's explosive growth in AI against its current valuation, keeping in mind that market dynamics can shift rapidly. Nvidia's success story is a testament to the transformative power of AI in the tech sector, yet the road ahead may require navigating through potential market corrections and ensuring that optimism aligns with realistic financial trajectories.
Summary:
Nvidia's report signals strong investment dynamics in AI and an undeniable demand for AI chips. Yet, it's important to acknowledge that not many companies can translate the AI demand into tangible free cash flows just yet. The risk doesn't lie in the AI technology but rather in the valuations. An influx of capital into a limited pool of stocks could lead to unhealthy speculative runs and inflated valuations in the long run. Nevertheless, Wall Street does not seem to be at the brink of such an event yet.
Useful Links
Important Notice
The begginers in forex trading need to be very careful when making decisions about entering the market. Before the release of important reports, it is best to stay out of the market to avoid being caught in sharp market fluctuations due to increased volatility. If you decide to trade during the news release, then always place stop orders to minimize losses.
Without placing stop orders, you can very quickly lose your entire deposit, especially if you do not use money management and trade large volumes. For successful trading, you need to have a clear trading plan and stay focues and disciplined. Spontaneous trading decision based on the current market situation is an inherently losing strategy for a scalper or daytrader.
#instaforex #analysis #sebastianseliga