empty
14.01.2025 03:14 AM
Trading Recommendations and Analysis for EUR/USD on January 14: Monday is No Reason to Rest

EUR/USD 5-Minute Analysis

This image is no longer relevant

The EUR/USD currency pair continued to decline on Monday, and it has become somewhat repetitive to mention this, as the euro has been falling consistently. This time, the pair reached the 1.0195 level, achieving our target range of $1.00–$1.02, as we had previously anticipated. However, we believe this does not mark the end of the euro's decline, as higher timeframes continue to indicate a long-term downtrend. While such trends eventually come to an end, there are currently no signs of a reversal.

On Monday, there were no significant economic releases or events in either the Eurozone or the U.S. Nevertheless, this did not stop the market from continuing to sell the euro. This reinforces the idea that global factors, rather than local ones, are driving the pair's movement. The global factors contributing to the euro's decline have been discussed extensively since last year, and no substantial changes have occurred. While the euro may experience temporary corrections, one might question the value of buying it when these movements appear to be purely corrective, especially given that previous corrections have been so weak.

On the 5-minute chart, several buy signals appeared around the 1.0195 level on Monday. Although buy signals can be significant, taking long positions during a strong downtrend is generally unwise. Additionally, these signals were notably imprecise, leading us to disregard them. Nevertheless, the second level did temporarily stop the euro's decline—for the time being.

COT Report

This image is no longer relevant

The latest Commitment of Traders (COT) report, dated December 31, indicates that non-commercial traders maintain a bullish net position. However, bears have recently gained the upper hand. Two months ago, the number of short positions among professional traders surged, resulting in a negative net position for the first time in a long while. This change suggests that the euro is being sold more frequently than it is being bought.

We have yet to identify any fundamental drivers for euro strength. From a technical perspective, the EUR/USD pair has been consolidating for quite some time. On the weekly timeframe, it has traded between 1.0448 and 1.1274 since December 2022. The breach of the 1.0448 level has opened the door for further declines.

Additionally, the COT data shows that the red and blue lines have crossed, signaling a bearish market sentiment. In the last reporting week, long positions among non-commercial traders increased by 9,300, while short positions rose by 10,400, resulting in a reduction of the net position by 1,100.

EUR/USD 1-Hour Analysis

This image is no longer relevant

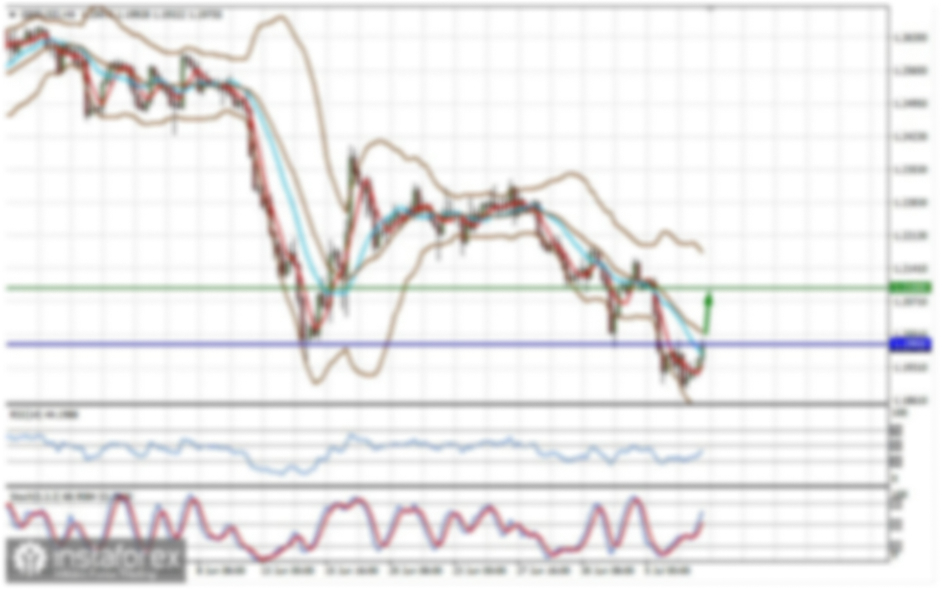
On the hourly timeframe, the currency pair has resumed its downtrend, which has been ongoing for over three months. We expect this decline to continue in the medium term. The Federal Reserve may cut interest rates only 1 to 2 times in 2025, which indicates a more hawkish stance than the market had anticipated. Therefore, we see no justification for significant growth of the euro. The pair remains bearish, even in the short term, as it trades below the Ichimoku indicator lines.

For January 14, we highlight the following trading levels: 1.0195, 1.0269, 1.0340–1.0366, 1.0461, 1.0524, 1.0585, 1.0658–1.0669, 1.0757, 1.0797, 1.0843, and 1.0889. Additionally, pay attention to the Senkou Span B at 1.0342 and the Kijun-sen at 1.0307. The Ichimoku lines may shift throughout the day, so traders should adjust accordingly when determining signals. Remember to set a stop loss at breakeven if the price moves 15 pips in your favor to mitigate potential losses from false signals.

The only noteworthy event on Tuesday is the release of the Producer Price Index (PPI) in the U.S.; however, we consider this report relatively minor. Later in the week, U.S. inflation data will be published, which deserves special attention. This report could potentially shift market expectations towards a more dovish outlook for Fed rate cuts in 2025, which might halt the dollar's rally.

Illustration Explanations:

  • Support and Resistance Levels (thick red lines): Thick red lines indicate where movement may come to an end. Please note that these lines are not sources of trading signals.
  • Kijun-sen and Senkou Span B Lines: Ichimoku indicator lines transferred from the 4-hour timeframe to the hourly timeframe. These are strong lines.
  • Extreme Levels (thin red lines): Thin red lines where the price has previously bounced. These serve as sources of trading signals.
  • Yellow Lines: Trendlines, trend channels, or any other technical patterns.
  • Indicator 1 on COT Charts: Represents the net position size for each category of traders.
Paolo Greco,
Analytical expert of InstaForex
© 2007-2025
Select timeframe
5
min
15
min
30
min
1
hour
4
hours
1
day
1
week
Earn on cryptocurrency rate changes with InstaForex
Download MetaTrader 4 and open your first trade
  • Grand Choice
    Contest by
    InstaForex
    InstaForex always strives to help you
    fulfill your biggest dreams.
    JOIN CONTEST

Recommended Stories

GBP/USD: Trading Plan for the U.S. Session on July 7th (Review of Morning Trades)

In my morning forecast, I highlighted the 1.3602 level and planned to use it to determine entry points into the market. Let's look at the 5-minute chart and analyze what

Miroslaw Bawulski 13:21 2025-07-07 UTC+2

EUR/USD: Trading Plan for the U.S. Session on July 7th (Review of the Morning Trades)

In my morning forecast, I highlighted the 1.1749 level and planned to base market entry decisions around it. Let's look at the 5-minute chart and break down what happened

Miroslaw Bawulski 13:20 2025-07-07 UTC+2

How to Trade the GBP/USD Currency Pair on July 7th? Simple Tips and Trade Review for Beginners

On Friday, the GBP/USD pair showed total flat movement and low volatility. As with the EUR/USD pair, there was no news that day, and no macroeconomic publications were released either

Paolo Greco 07:48 2025-07-07 UTC+2

How to Trade the EUR/USD Currency Pair on July 7th: Simple Tips and Trade Analysis for Beginners

Friday Trade Analysis: EUR/USD 1H Chart The EUR/USD pair stayed flat all day Friday, with volatility totaling 36 points, clearly indicating a lack of trading activity. This is not surprising

Paolo Greco 07:32 2025-07-07 UTC+2

GBP/USD Trading Recommendations and Trade Analysis for July 7th

The GBP/USD currency pair traded with low volatility and primarily moved sideways. As mentioned earlier, last week was particularly interesting in how the market interpreted various events and publications

Paolo Greco 07:11 2025-07-07 UTC+2

EUR/USD Trading Recommendations and Trade Analysis for July 7th

The EUR/USD currency pair did not exhibit any notable movements on Friday—or any movements at all. Friday was Independence Day in the United States, effectively making it a non-trading

Paolo Greco 07:03 2025-07-07 UTC+2

GBP/USD: Trading Plan for the U.S. Session on July 4th (Review of Morning Trades)

In my morning forecast, I highlighted the 1.3672 level as a key decision point for entering the market. Let's look at the 5-minute chart and analyze what happened. A rise

Miroslaw Bawulski 18:20 2025-07-04 UTC+2

EUR/USD: Trading Plan for the U.S. Session on July 4th (Review of Morning Trades)

In my morning forecast, I highlighted the 1.1787 level as a key point for making trading decisions. Let's look at the 5-minute chart to analyze what happened. A rise

Miroslaw Bawulski 18:16 2025-07-04 UTC+2

How to Trade the GBP/USD Pair on July 4? Simple Tips and Trade Analysis for Beginners

Analysis of Thursday's Trades 1H Chart of GBP/USD On Thursday, the GBP/USD pair once again plummeted, but this time the drop in the British currency lasted only five minutes

Paolo Greco 07:16 2025-07-04 UTC+2

How to Trade the EUR/USD Pair on July 4? Simple Tips and Trade Analysis for Beginners

Analysis of Thursday's Trades 1H Chart of EUR/USD The EUR/USD currency pair traded throughout Thursday, both before and after the publication of the U.S. Nonfarm Payrolls and unemployment data

Paolo Greco 06:34 2025-07-04 UTC+2
Can't speak right now?
Ask your question in the chat.
Widget callback
 

Dear visitor,

Your IP address shows that you are currently located in the USA. If you are a resident of the United States, you are prohibited from using the services of InstaFintech Group including online trading, online transfers, deposit/withdrawal of funds, etc.

If you think you are seeing this message by mistake and your location is not the US, kindly proceed to the website. Otherwise, you must leave the website in order to comply with government restrictions.

Why does your IP address show your location as the USA?

  • - you are using a VPN provided by a hosting company based in the United States;
  • - your IP does not have proper WHOIS records;
  • - an error occurred in the WHOIS geolocation database.

Please confirm whether you are a US resident or not by clicking the relevant button below. If you choose the wrong option, being a US resident, you will not be able to open an account with InstaForex anyway.

We are sorry for any inconvenience caused by this message.