empty
14.03.2025 03:29 PM
EUR/USD: March 14th. Bears Make Weak Attempts

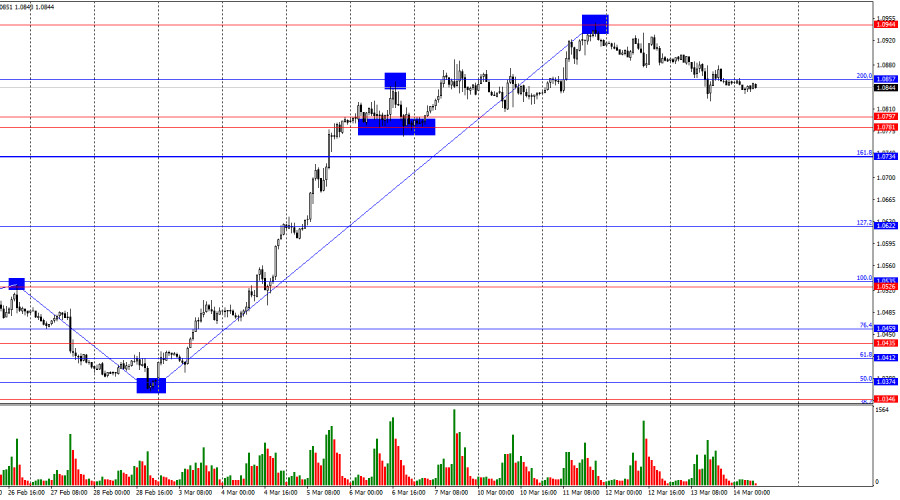
On Thursday, the EUR/USD pair continued its decline and consolidated below the 200.0% corrective level at 1.0857. This suggests that the downward movement could extend toward the next support zone at 1.0781–1.0797, as well as the 161.8% Fibonacci level at 1.0734. A break above 1.0857 would indicate a potential reversal in favor of the euro, leading to a renewed uptrend toward 1.0944.

This image is no longer relevant

The wave structure on the hourly chart has changed. The last completed downward wave broke below the previous low, while the last upward wave broke above the previous peak, indicating that a bullish trend is forming. However, the current impulsive growth is largely driven by concerns over a U.S. economic slowdown due to Donald Trump's policy measures. This appears to be the primary reason for the recent weakness of the U.S. dollar.

Thursday's fundamental background was mixed, as was traders' reaction. The market is currently paying little attention to economic data, focusing instead on the broader outlook for the U.S. and global economy. While a rise in Eurozone industrial production is a positive factor, it is not enough to sustain further euro growth at this time. Similarly, a decline in the U.S. Producer Price Index (PPI) is also favorable, but the dollar requires stronger, more significant economic data to regain momentum.

The key market driver remains U.S. President Donald Trump, who yesterday suggested the possibility of taking Greenland by military force. He also claimed that the entire world is exploiting America and that it is time to change that. As a result, we can expect many major geopolitical events in the near future—but unlike economic reports, these developments do not appear on the calendar. News could emerge unexpectedly, and traders' reactions may be just as unpredictable.

This image is no longer relevant

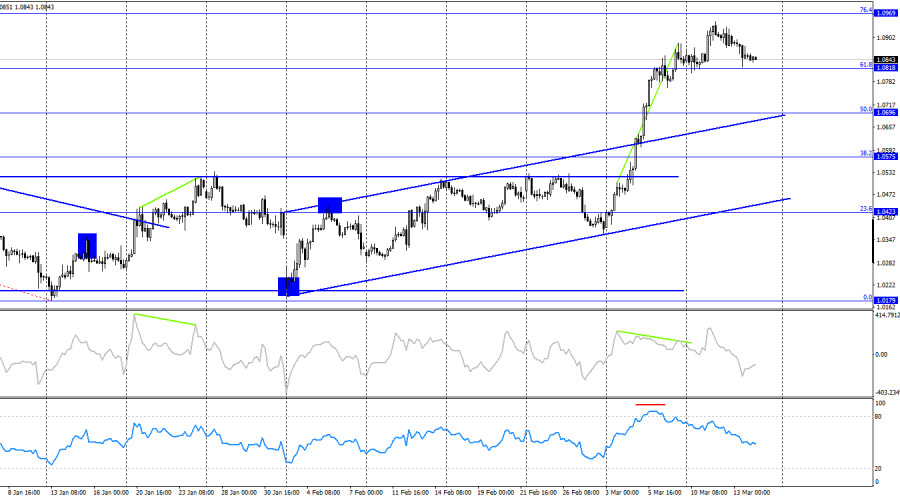
On the four-hour chart, the bullish trend continues, with the pair maintaining an uptrend after breaking out of a horizontal channel. The ascending trend corridor confirms this bullish sentiment. A break above the 61.8% Fibonacci level at 1.0818 could lead to further gains toward the 76.4% Fibonacci level at 1.0969.

At the same time, a bearish divergence on the CCI indicator and overbought conditions on the RSI signal that the pair may be ready for a correction, though bears have been attacking very weakly. A break below 1.0818 would indicate a possible decline toward 1.0696.

Commitments of Traders (COT) Report:

This image is no longer relevant

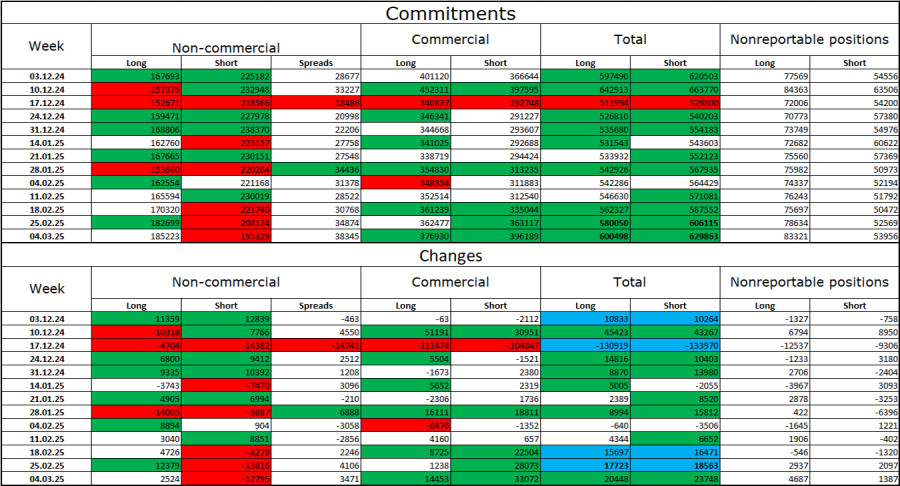
During the latest reporting week, professional traders opened 2,524 long positions and closed 12,795 short positions. The sentiment among Non-commercial traders remains bearish, but it has been weakening recently.

The total number of long positions among speculators now stands at 185,000, while short positions amount to 195,000.

For twenty consecutive weeks, large investors were selling the euro, confirming a bearish trend with no signs of reversal. The divergence in monetary policy between the ECB and the Federal Reserve still favors the U.S. dollar, as the interest rate differential remains in the dollar's favor. While the bearish advantage is starting to erode, it is too early to declare the downtrend over.

Interestingly, the number of long positions has been increasing for five consecutive weeks, coinciding with Donald Trump's presidency—a development worth noting.

Economic Calendar for the U.S. and Eurozone:

  • Eurozone – Germany Consumer Price Index (07:00 UTC)
  • U.S. – University of Michigan Consumer Sentiment Index (14:00 UTC)

On March 14, the economic calendar includes two events, but both are low-impact. The overall market sentiment on Friday is likely to be minimally influenced by fundamental data.

EUR/USD Forecast and Trading Recommendations:

Selling the pair is possible if EUR/USD consolidates below 1.0857 on the hourly chart, with targets at 1.0797 and 1.0734.

Buying opportunities exist, but the strong and uninterrupted rally remains concerning. I remain cautious about such one-sided movements, as they often signal potential market reversals or corrections.

Fibonacci levels are drawn from 1.0529–1.0213 on the hourly chart and from 1.1214–1.0179 on the four-hour chart.

Samir Klishi,
Analytical expert of InstaForex
© 2007-2025
Select timeframe
5
min
15
min
30
min
1
hour
4
hours
1
day
1
week
Earn on cryptocurrency rate changes with InstaForex
Download MetaTrader 4 and open your first trade
  • Grand Choice
    Contest by
    InstaForex
    InstaForex always strives to help you
    fulfill your biggest dreams.
    JOIN CONTEST

Recommended Stories

Forex forecast 16/06/2025: EUR/USD, GBP/USD, USD/JPY, Oil, Gold and Bitcoin

Useful links: My other articles are available in this section InstaForex course for beginners Popular Analytics Open trading account Important: The begginers in forex trading need to be very careful

Sebastian Seliga 10:30 2025-06-16 UTC+2

GBP/USD – June 16th: Bulls Hold the 1.3527 Level

On the hourly chart, the GBP/USD pair on Friday rebounded twice from the 127.2% Fibonacci retracement level at 1.3527 and rose toward the resistance zone of 1.3611–1.3633. However, prior

Samir Klishi 10:27 2025-06-16 UTC+2

Technical Analysis of Daily Price Movement of USD/IDR Exotic Currency Pairs, Monday June 16, 2025.

With the appearance of the Bullish 123 pattern in the midst of the weakening conditions of this exotic currency pair, that has been confirmed by the movement of the USD/IDR

Arief Makmur 07:16 2025-06-16 UTC+2

Technical Analysis of Intraday Price Movement of Crude Oil Commodity Instrument, Monday June 16, 2025.

On the 4-hour chart of the Crude Oil commodity instrument, there is an appearance of Divergence between the #CL price movement and the Stochastic Oscillator indicator, indicating that

Arief Makmur 07:16 2025-06-16 UTC+2

Trading Signals for EUR/USD for June 13-19, 2025: buy above 1.1500 (21 SMA - 7/8 Murray)

Under the opposite scenario, if the euro falls below 1.1490, it is likely to reach the 200 EMA, which is located at 1.1340 and coincides with the bottom

Dimitrios Zappas 14:14 2025-06-13 UTC+2

Trading Signals for GOLD for June 13-19, 2025: sell below 3,343 (21 SMA - 8/8 Murray)

Gold has left a gap at 3,282 and another around 3,181. So, if the price falls below the psychological level of 3,300, we could expect it to fall to cover

Dimitrios Zappas 14:12 2025-06-13 UTC+2

Forecast for EUR/USD on June 13, 2025

On Thursday, the EUR/USD pair continued its upward movement and consolidated above the 100.0% Fibonacci retracement level at 1.1574. However, during the night, a sharp reversal occurred in favor

Samir Klishi 11:52 2025-06-13 UTC+2

Forecast for GBP/USD on June 13, 2025

On the hourly chart, the GBP/USD pair on Thursday rebounded from the 1.3520 level, surged to the resistance zone of 1.3611–1.3620, bounced off it twice, and then fell back

Samir Klishi 11:49 2025-06-13 UTC+2

EUR/USD. June 12. A Setback for the Dollar

Good day, dear traders! On Wednesday, the EUR/USD pair continued its upward movement after rebounding from the support zone of 1.1374–1.1380. It successfully consolidated above the 76.4% Fibonacci retracement level

Samir Klishi 10:15 2025-06-12 UTC+2

GBP/USD. June 12. British Economy Falters

Good day, dear traders! On the hourly chart, on Wednesday, the GBP/USD pair reversed in favor of the British pound and consolidated above the 161.8% Fibonacci retracement level at 1.3520

Samir Klishi 10:15 2025-06-12 UTC+2
Can't speak right now?
Ask your question in the chat.
Widget callback
 

Dear visitor,

Your IP address shows that you are currently located in the USA. If you are a resident of the United States, you are prohibited from using the services of InstaFintech Group including online trading, online transfers, deposit/withdrawal of funds, etc.

If you think you are seeing this message by mistake and your location is not the US, kindly proceed to the website. Otherwise, you must leave the website in order to comply with government restrictions.

Why does your IP address show your location as the USA?

  • - you are using a VPN provided by a hosting company based in the United States;
  • - your IP does not have proper WHOIS records;
  • - an error occurred in the WHOIS geolocation database.

Please confirm whether you are a US resident or not by clicking the relevant button below. If you choose the wrong option, being a US resident, you will not be able to open an account with InstaForex anyway.

We are sorry for any inconvenience caused by this message.