


signal strength 1 of 5
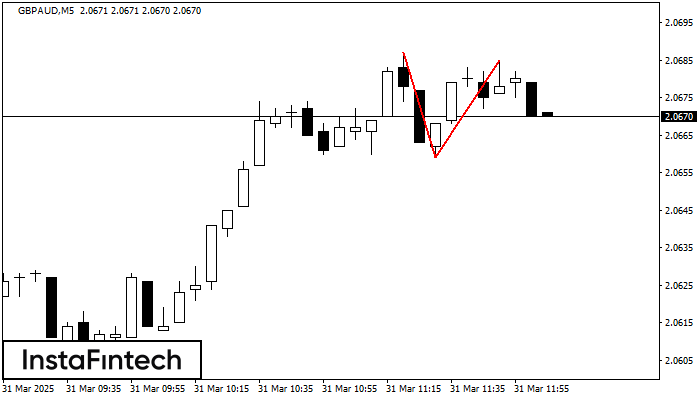
The Double Top reversal pattern has been formed on GBPAUD M5. Characteristics: the upper boundary 2.0687; the lower boundary 2.0659; the width of the pattern is 26 points. Sell trades are better to be opened below the lower boundary 2.0659 with a possible movements towards the 2.0644 level.
The M5 and M15 time frames may have more false entry points.
See Also
- All
- Double Top
- Flag
- Head and Shoulders
- Pennant
- Rectangle
- Triangle
- Triple top
- All
- #AAPL
- #AMZN
- #Bitcoin
- #EBAY
- #FB
- #GOOG
- #INTC
- #KO
- #MA
- #MCD
- #MSFT
- #NTDOY
- #PEP
- #TSLA
- #TWTR
- AUDCAD
- AUDCHF
- AUDJPY
- AUDUSD
- EURCAD
- EURCHF
- EURGBP
- EURJPY
- EURNZD
- EURRUB
- EURUSD
- GBPAUD
- GBPCHF
- GBPJPY
- GBPUSD
- GOLD
- NZDCAD
- NZDCHF
- NZDJPY
- NZDUSD
- SILVER
- USDCAD
- USDCHF
- USDJPY
- USDRUB
- All
- M5
- M15
- M30
- H1
- D1
- All
- Buy
- Sale
- All
- 1
- 2
- 3
- 4
- 5
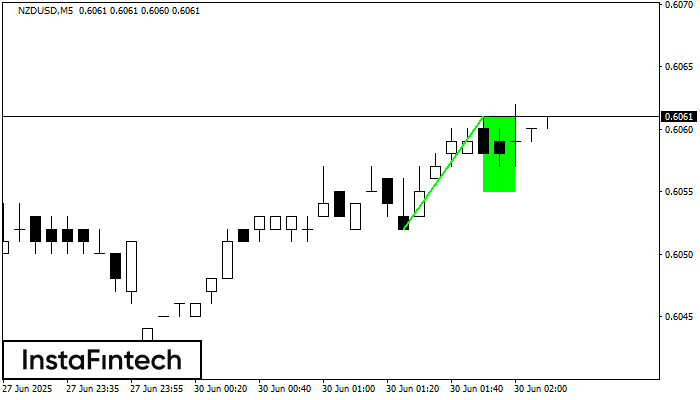
По NZDUSD на M5 сформировалась фигура «Бычий флаг». Нижняя граница фигуры имеет координаты 0.6055/0.6055, при этом верхняя граница 0.6061/0.6061. Проекция высоты флагштока 9 пунктов. Формирование фигуры «Бычий флаг» наиболее вероятным
Таймфреймы М5 и М15 могут иметь больше ложных точек входа.
Открыть график инструмента в новом окне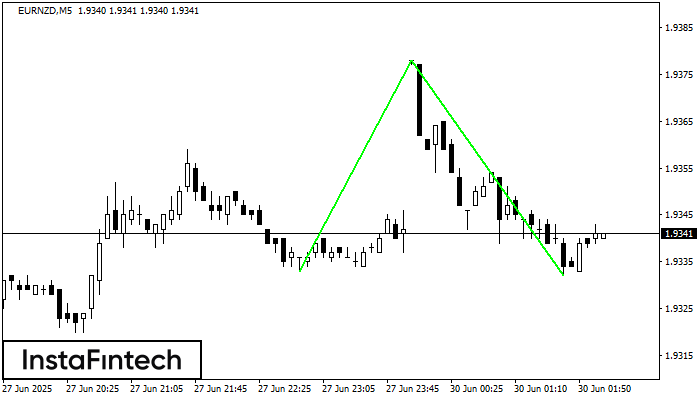
Сформирована фигура «Двойное дно» на графике EURNZD M5. Характеристика: Уровень поддержки 1.9333; Уровень сопротивления 1.9378; Ширина фигуры 45 пунктов. В случае пробоя уровня сопротивления можно будет прогнозировать изменение тенденции
Таймфреймы М5 и М15 могут иметь больше ложных точек входа.
Открыть график инструмента в новом окне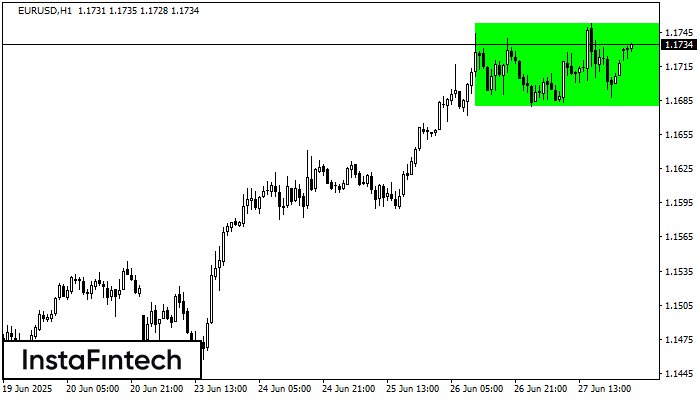
По торговому инструменту EURUSD на H1 сформировалась фигура продолжения тренда - «Прямоугольник». Фигура имеет границы: Нижняя 1.1680; Верхняя 1.1753. В случае пробоя верхней границы вероятно дальнейшее движение в сторону тренда
Открыть график инструмента в новом окне


