empty
27.10.2023 02:27 PM
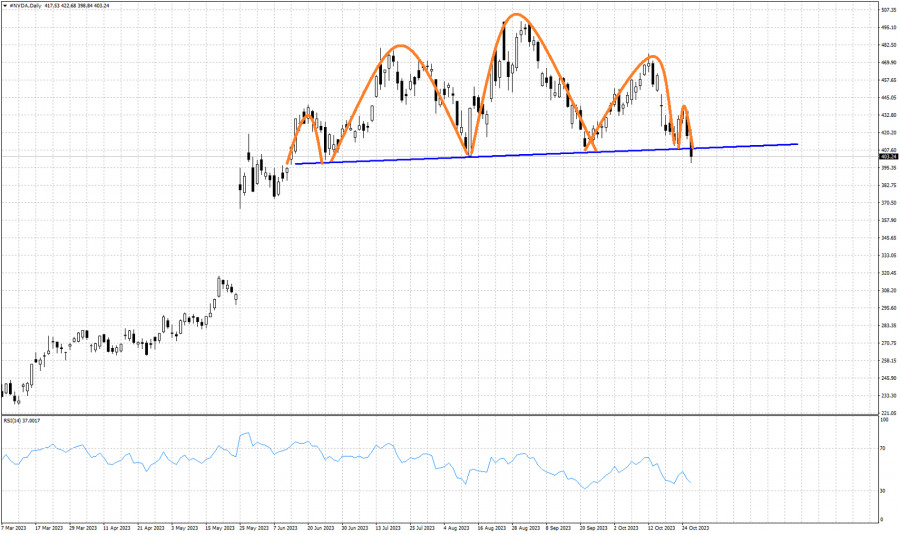
Bearish Head and Shoulders pattern in NVDA stock chart suggests more downside should be expected.

This image is no longer relevant

Blue line- neckline support

Orange lines- Head and shoulders pattern

NVDA stock price recently broke below the $407.50 price level pushing price to new 4 month lows. A bearish Head and Shoulders pattern has been activated in the NVDA chart as price has just broken below the neckline support. NVDA stock price is expected to be under selling pressures over the coming weeks. In order for this bearish scenario to get cancelled, we need to see price break above at least the $437 price level where the second right hand shoulder formed. Otherwise we should expect NVDA to fall towards the $320 price level.

Select timeframe
5
min
15
min
30
min
1
hour
4
hours
1
day
1
week
Earn on cryptocurrency rate changes with InstaForex
Download MetaTrader 4 and open your first trade
  • Grand Choice
    Contest by
    InstaForex
    InstaForex always strives to help you
    fulfill your biggest dreams.
    JOIN CONTEST

Recommended Stories

US Market: stalling below yearly highs

S&P 500 Overview for May 15 US Market: stalling below yearly highs Performance of the key US indices on Wednesday: Dow -0.2% | NASDAQ +0.7% | S&P 500 +0.1% S&P

Jozef Kovach 12:59 2025-05-15 UTC+2

Stock market buy and sell recommendations for May 15, 2025

Buying JP Morgan Chase shares (#JPM) JP Morgan Chase is an American multinational financial conglomerate. On the weekly chart, the stock has accelerated to the upside, likely aiming to reach

Laurie Bailey 12:56 2025-05-15 UTC+2

Update on US stock market on May 14

S&P500 Snapshot of benchmark US stock indices on Tuesday: Dow -0.6%, NASDAQ +1.6%, S&P 500 +0.7%. S&P 500: 5,886, range 5,400–6,200. Yesterday was another winning session for stocks. The S&P

Jozef Kovach 13:05 2025-05-14 UTC+2

Stock market buy and sell recommendations for May 14, 2025

Buying company shares (#IBM) International Business Machines (IBM) is one of the largest US-based IT companies, engaged in hardware manufacturing, software development, and more. On the daily chart, Monday's session

Laurie Bailey 13:03 2025-05-14 UTC+2

S&P 500 Forecast for May 14, 2025

On the weekly chart, the price has broken through the resistance of the embedded line of the green price channel and reached the target level of 5,908, the low from

Laurie Bailey 12:53 2025-05-14 UTC+2

Update on US stock market on May 9. SP500 and NASDAQ trading higher

At the close of the last regular session, US stock indexes ended in the green. The S&P 500 rose by 0.58%, the Nasdaq 100 gained 1.07%, and the industrial

Jakub Novak 15:36 2025-05-09 UTC+2

S&P 500 Forecast for May 9, 2025

The U.S. stock market has overcome uncertainty and is set for growth towards new all-time highs. The price has settled above the indicator lines of the Balance Line

Laurie Bailey 05:15 2025-05-09 UTC+2

Update on US stock market on May 8. SP500 and NASDAQ grow after Fed's policy meeting

US benchmark stock indices closed the previous regular session with gains. The S&P 500 rose by 0.43%, the Nasdaq 100 added 0.27%, and the industrial Dow Jones climbed 0.70%. Futures

Jakub Novak 16:22 2025-05-08 UTC+2

Update on US stock market on May 7. Fed's policy decision on investors' radars

S&P500 Update on US market: pullback ahead of the Fed's policy meeting Snapshot of major US stock indexes on Tuesday: Dow -1%, NASDAQ -0.9%, S&P 500 -0.8%, S&P

Jozef Kovach 11:14 2025-05-07 UTC+2

Update on US stock market on May 6, 2025

S&P500 Overview on May 6 Snapshot of key US majo stock indices on Monday: * Dow: -0.2%, * NASDAQ: -0.7%, * S&P 500: -0.6% * S&P 500 closed at 5,650

Jozef Kovach 16:47 2025-05-06 UTC+2
Can't speak right now?
Ask your question in the chat.
Widget callback
 

Dear visitor,

Your IP address shows that you are currently located in the USA. If you are a resident of the United States, you are prohibited from using the services of InstaFintech Group including online trading, online transfers, deposit/withdrawal of funds, etc.

If you think you are seeing this message by mistake and your location is not the US, kindly proceed to the website. Otherwise, you must leave the website in order to comply with government restrictions.

Why does your IP address show your location as the USA?

  • - you are using a VPN provided by a hosting company based in the United States;
  • - your IP does not have proper WHOIS records;
  • - an error occurred in the WHOIS geolocation database.

Please confirm whether you are a US resident or not by clicking the relevant button below. If you choose the wrong option, being a US resident, you will not be able to open an account with InstaForex anyway.

We are sorry for any inconvenience caused by this message.