

signal strength 4 of 5

According to the chart of H1, AUDUSD formed the Inverse Head and Shoulder pattern. The Head’s top is set at 0.6315 while the median line of the Neck is found at 0.6220/0.6291. The formation of the Inverse Head and Shoulder pattern evidently signals a reversal of the downward trend. In other words, in case the scenario comes true, the price of AUDUSD will go towards 0.6355
See Also
- All
- Double Top
- Flag
- Head and Shoulders
- Pennant
- Rectangle
- Triangle
- Triple top
- All
- #AAPL
- #AMZN
- #Bitcoin
- #EBAY
- #FB
- #GOOG
- #INTC
- #KO
- #MA
- #MCD
- #MSFT
- #NTDOY
- #PEP
- #TSLA
- #TWTR
- AUDCAD
- AUDCHF
- AUDJPY
- AUDUSD
- EURCAD
- EURCHF
- EURGBP
- EURJPY
- EURNZD
- EURRUB
- EURUSD
- GBPAUD
- GBPCHF
- GBPJPY
- GBPUSD
- GOLD
- NZDCAD
- NZDCHF
- NZDJPY
- NZDUSD
- SILVER
- USDCAD
- USDCHF
- USDJPY
- USDRUB
- All
- M5
- M15
- M30
- H1
- D1
- All
- Buy
- Sale
- All
- 1
- 2
- 3
- 4
- 5
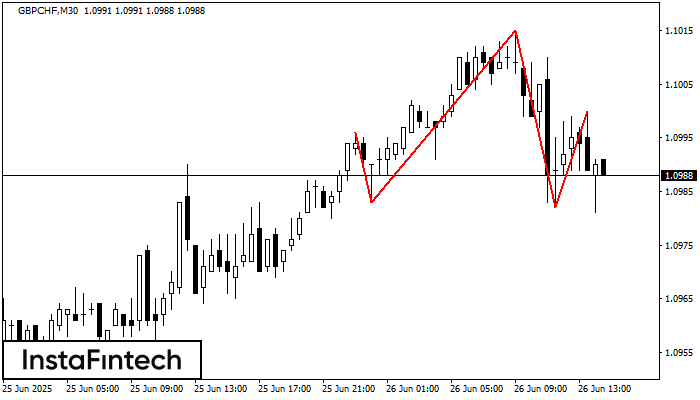
На графике GBPCHF M30 сформировалась фигура «Голова и плечи» с характеристикой: Вершина головы 1.1015; Уровень шеи, восходящий угол - 1.0983/1.0982. Формирование данной фигуры может привести к изменению текущей тенденции
Открыть график инструмента в новом окне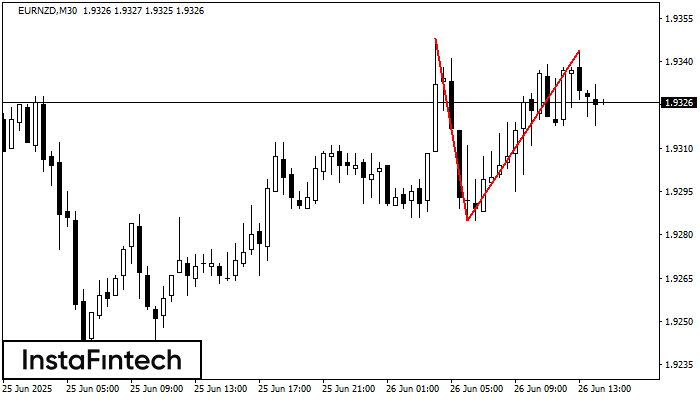
На торговом графике EURNZD M30 сформировалась разворотная фигура «Двойная вершина». Характеристика: Верхняя граница 1.9344; Нижняя граница 1.9285; Ширина фигуры 59 пунктов. Сигнал: Пробой нижней границы 1.9285 приведет к дальнейшему нисходящему
Открыть график инструмента в новом окне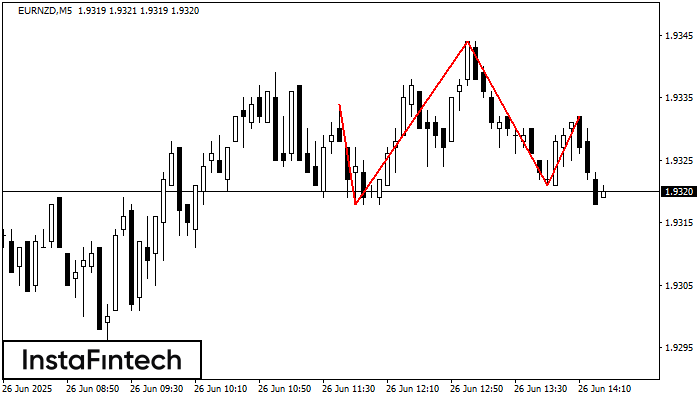
Графическая фигура «Голова и плечи» сформировалась по инструменту EURNZD на M5. Вероятно предполагать, что после формирования правого плеча цена преодолеет уровень шеи 1.9318/1.9321, изменяя тем самым тенденцию и фактически направляя
Таймфреймы М5 и М15 могут иметь больше ложных точек входа.
Открыть график инструмента в новом окне


