


signal strength 4 of 5
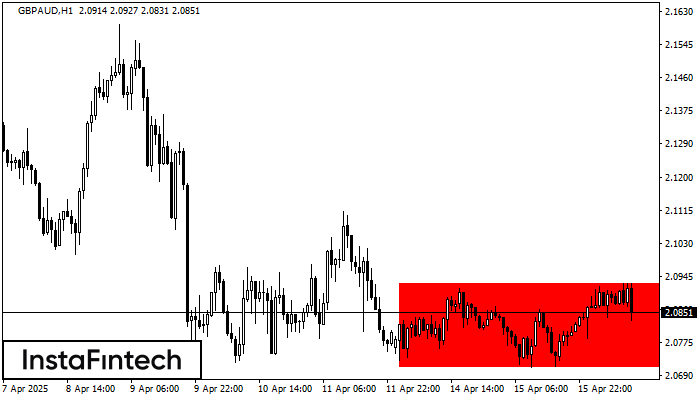
According to the chart of H1, GBPAUD formed the Bearish Rectangle. The pattern indicates a trend continuation. The upper border is 2.0927, the lower border is 2.0711. The signal means that a short position should be opened after fixing a price below the lower border 2.0711 of the Bearish Rectangle.
See Also
- All
- Double Top
- Flag
- Head and Shoulders
- Pennant
- Rectangle
- Triangle
- Triple top
- All
- #AAPL
- #AMZN
- #Bitcoin
- #EBAY
- #FB
- #GOOG
- #INTC
- #KO
- #MA
- #MCD
- #MSFT
- #NTDOY
- #PEP
- #TSLA
- #TWTR
- AUDCAD
- AUDCHF
- AUDJPY
- AUDUSD
- EURCAD
- EURCHF
- EURGBP
- EURJPY
- EURNZD
- EURRUB
- EURUSD
- GBPAUD
- GBPCHF
- GBPJPY
- GBPUSD
- GOLD
- NZDCAD
- NZDCHF
- NZDJPY
- NZDUSD
- SILVER
- USDCAD
- USDCHF
- USDJPY
- USDRUB
- All
- M5
- M15
- M30
- H1
- D1
- All
- Buy
- Sale
- All
- 1
- 2
- 3
- 4
- 5
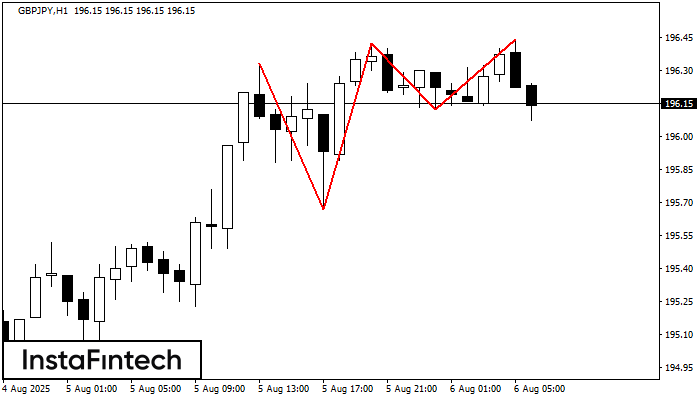
The Triple Top pattern has formed on the chart of the GBPJPY H1. Features of the pattern: borders have an ascending angle; the lower line of the pattern
Open chart in a new window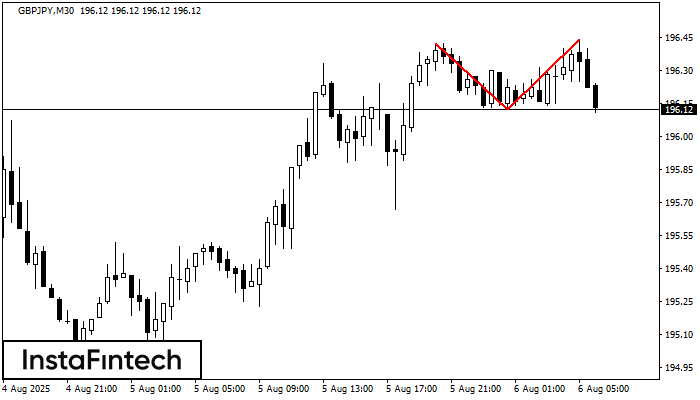
On the chart of GBPJPY M30 the Double Top reversal pattern has been formed. Characteristics: the upper boundary 196.44; the lower boundary 196.12; the width of the pattern 32 points
Open chart in a new window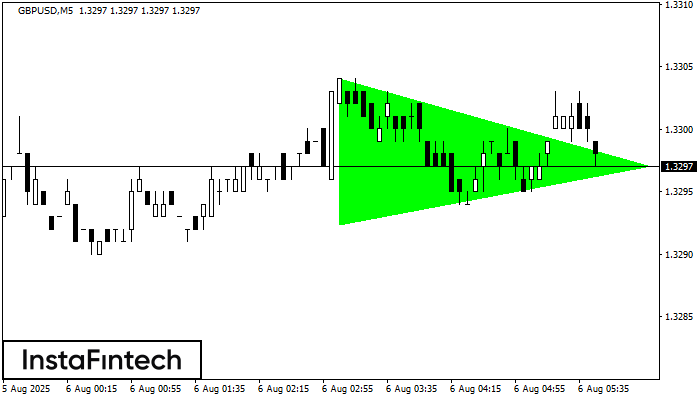
According to the chart of M5, GBPUSD formed the Bullish Symmetrical Triangle pattern, which signals the trend will continue. Description. The upper border of the pattern touches the coordinates 1.3304/1.3297
The M5 and M15 time frames may have more false entry points.
Open chart in a new window


