Stay
Stay 
Trading Conditions
Products
Tools


The EUR/USD currency pair traded lower on Tuesday. Once again, volatility was far from low, which might suggest the presence of significant events or news during the day. However, there were none. Overall, Trump's rhetoric remains unchanged. For example, on Tuesday, the White House announced its readiness to impose tariffs on all solar panel imports from Asia. Meanwhile, they continue discussing trade negotiations with various countries, although no information is coming from those countries themselves. On the contrary, the European Union stated that they do not understand Trump's demands and that no progress is being made in the negotiations.
Thus, the market remains in chaos, if not outright panic. On Monday, the dollar plunged again, only to recover on Tuesday. There is practically no logic in the movements, and the market is ignoring many technical levels. The news flow continues to fuel market instability. The market is highly sensitive to any reports of a potential escalation in the global trade conflict and the ongoing Powell-Trump standoff.
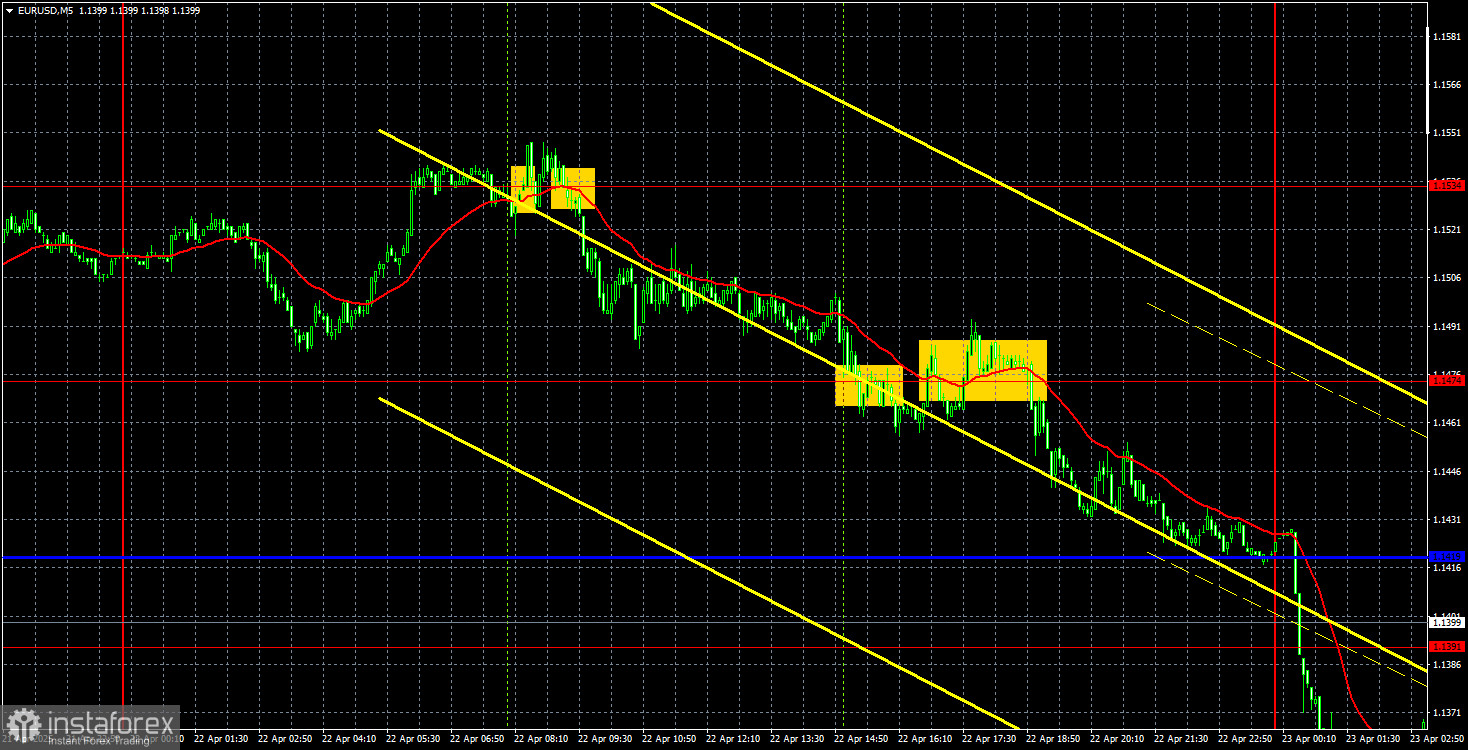
Several trading signals were formed on Tuesday, but as previously mentioned, the market eagerly ignored all technical levels. As a result, many false signals emerged near the 1.1534 and 1.1474 levels. Once again, we emphasize that current price movements are extremely difficult to describe as logical or consistent. Regardless of what lies ahead for the U.S. economy, the dollar has dropped by 1100 pips against the euro in just two months—even though there has been little positive news from the Eurozone during that time.
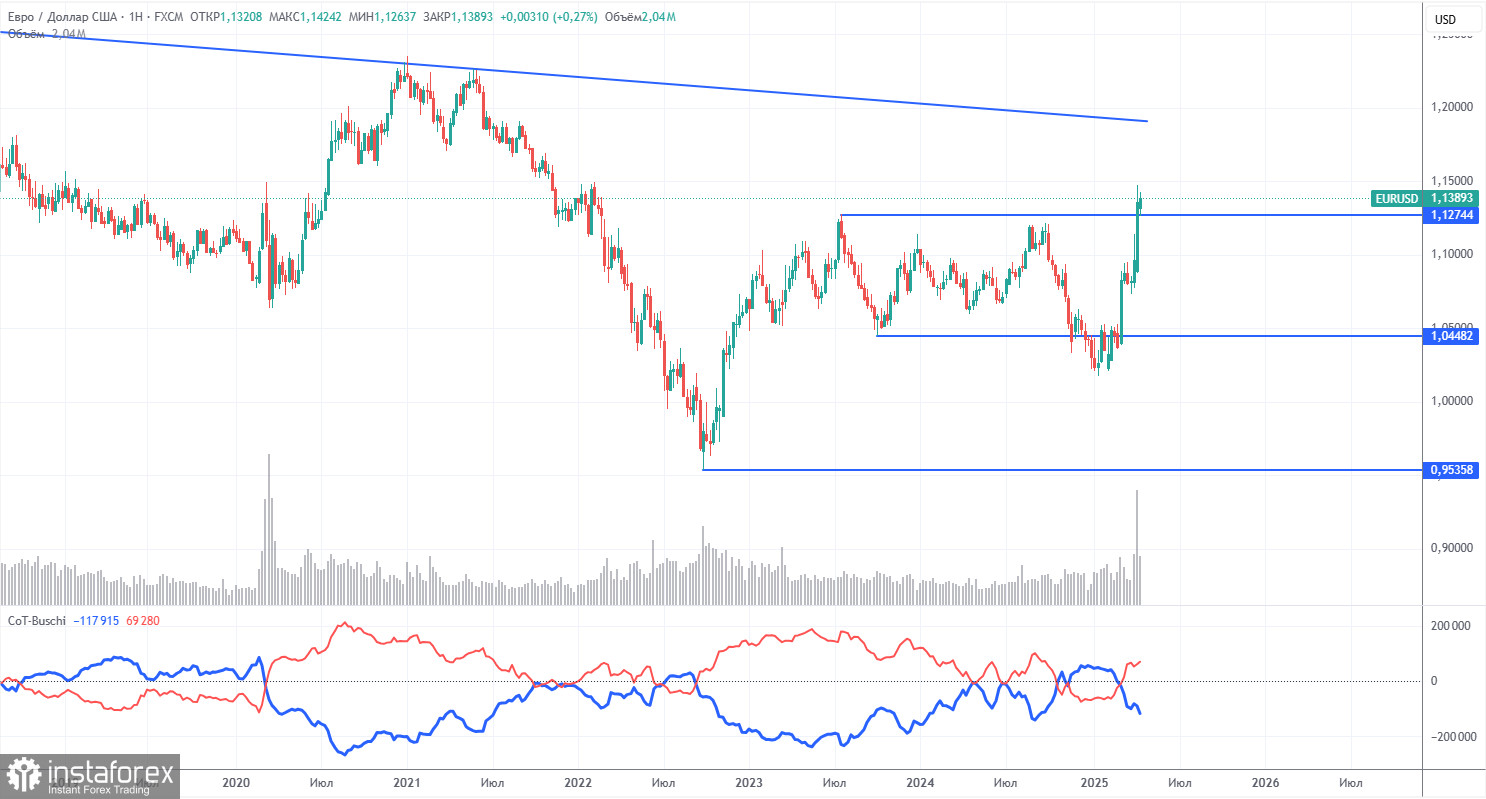
The latest COT report is dated April 15. The chart above clearly shows that the net position of non-commercial traders had long remained bullish. Bears barely managed to gain the upper hand but quickly lost it again. The bears' advantage has visibly diminished since Trump took office, and the dollar sharply declined. We cannot definitively say that the decline of the U.S. currency will continue, but COT reports reflect the sentiment of large players—which can change rapidly under the current circumstances.
We still see no fundamental factors justifying euro strength, but one significant factor is now driving dollar weakness. The pair may continue to correct for several more weeks or months, but a 16-year downtrend won't reverse so easily.
The red and blue lines have now crossed again, signaling a bullish trend in the market. During the latest reporting week, the "Non-commercial" group increased its long positions by 6,800 and reduced its short positions by 2,500, resulting in a net increase of 9,300 contracts.
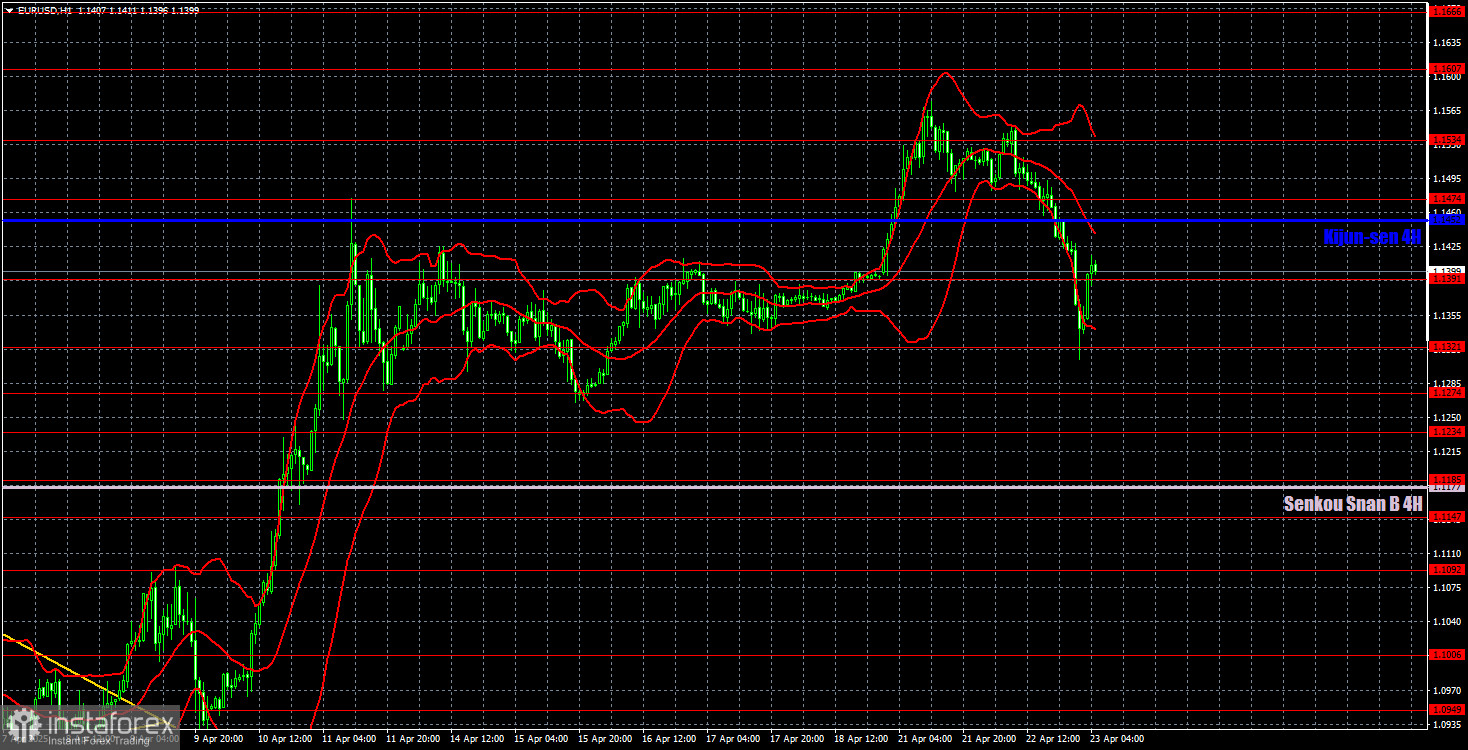
The EUR/USD pair continues its upward trend on the hourly timeframe, although there are no distinct trend lines or channels. On the daily timeframe, it is now official: the long-term downtrend has been broken. This would never have happened if Trump hadn't started a trade war. As a result, the fundamental backdrop has overridden the technical picture—a rare but not impossible event. Unfortunately, the upward trend could end just as sharply and unexpectedly if Trump stops imposing tariffs and moves toward de-escalation. There is very little logic or technical structure in the price action across any timeframe.
For April 23, we highlight the following levels for trading: 1.0823, 1.0886, 1.0949, 1.1006, 1.1092, 1.1147, 1.1185, 1.1234, 1.1274, 1.1321, 1.1391, 1.1474, 1.1607, 1.1666, as well as the Senkou Span B (1.1177) and Kijun-sen (1.1452) lines. Remember that Ichimoku indicator lines can shift throughout the day, which should be considered when identifying trading signals. Don't forget to place a Stop Loss at breakeven if the price moves 15 pips in your favor—this will help protect you from potential losses if the signal turns out to be false.
On Wednesday, preliminary PMIs for April will be published in Germany, the Eurozone, and the U.S. These are fairly interesting data points, but the market is ignoring even more significant macroeconomic indicators. The key issues on the agenda remain the Trump-Powell conflict and the global trade war. The market continues to operate in a state of chaos.
InstaForex analytical reviews will make you fully aware of market trends! Being an InstaForex client, you are provided with a large number of free services for efficient trading.
Your IP address shows that you are currently located in the USA. If you are a resident of the United States, you are prohibited from using the services of Instant Trading EU Ltd including online trading, online transfers, deposit/withdrawal of funds, etc.
If you think you are seeing this message by mistake and your location is not the US, kindly proceed to the website. Otherwise, you must leave the website in order to comply with government restrictions.
Why does your IP address show your location as the USA?
Please confirm whether you are a US resident or not by clicking the relevant button below. If you choose the wrong option, being a US resident, you will not be able to open an account with InstaForex anyway.
We are sorry for any inconvenience caused by this message.