


signal strength 3 of 5
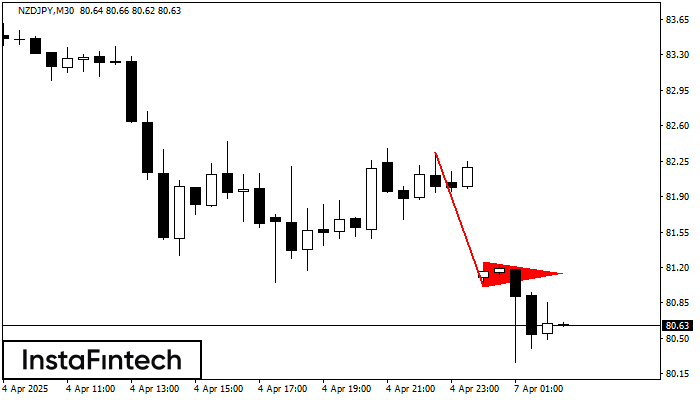
The Bearish pennant pattern has formed on the NZDJPY M30 chart. This pattern type is characterized by a slight slowdown after which the price will move in the direction of the original trend. In case the price fixes below the pattern’s low of 81.01, a trader will be able to successfully enter the sell position.
- All
- Double Top
- Flag
- Head and Shoulders
- Pennant
- Rectangle
- Triangle
- Triple top
- All
- #AAPL
- #AMZN
- #Bitcoin
- #EBAY
- #FB
- #GOOG
- #INTC
- #KO
- #MA
- #MCD
- #MSFT
- #NTDOY
- #PEP
- #TSLA
- #TWTR
- AUDCAD
- AUDCHF
- AUDJPY
- AUDUSD
- EURCAD
- EURCHF
- EURGBP
- EURJPY
- EURNZD
- EURRUB
- EURUSD
- GBPAUD
- GBPCHF
- GBPJPY
- GBPUSD
- GOLD
- NZDCAD
- NZDCHF
- NZDJPY
- NZDUSD
- SILVER
- USDCAD
- USDCHF
- USDJPY
- USDRUB
- All
- M5
- M15
- M30
- H1
- D1
- All
- Buy
- Sale
- All
- 1
- 2
- 3
- 4
- 5
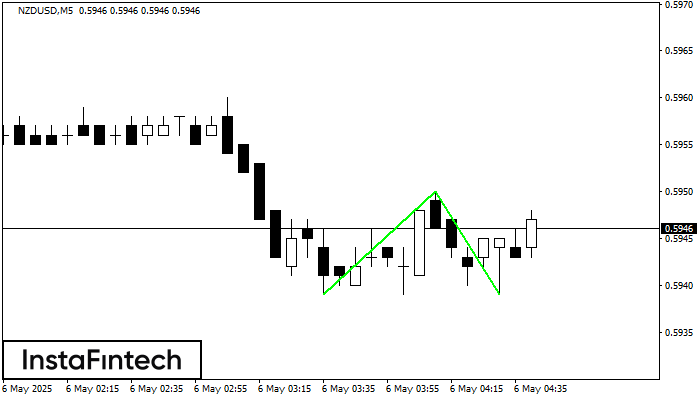
Corak Double Bottom telah dibentuk pada NZDUSD M5; sempadan atas adalah 0.5950; sempadan bawah adalah 0.5939. Lebar corak adalah 11 mata. Sekiranya penembusan sempadan atas 0.5950, perubahan aliran boleh diramalkan
Carta masa M5 dan M15 mungkin mempunyai lebih banyak titik kemasukan palsu.
Open chart in a new window
Corak Triple Bottom telah dibentuk pada GBPCHF H1. Ia mempunyai ciri-ciri berikut: tahap rintangan 1.0997/1.0988; tahap sokongan 1.0919/1.0919; lebar corak adalah 78 mata. Dalam situasi penembusan paras rintangan 1.0997, harga
Open chart in a new window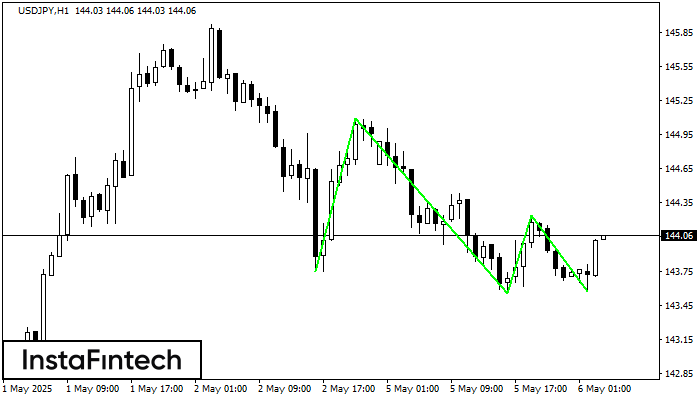
Corak Triple Bottom telah dibentuk pada carta USDJPY H1. Ciri-ciri corak: Garisan bawah corak mempunyai koordinat 145.09 dengan had atas 145.09/144.24, unjuran lebar adalah 134 mata. Pembentukan corak Triple Bottom
Open chart in a new window


