сила сигнала 1 из 5
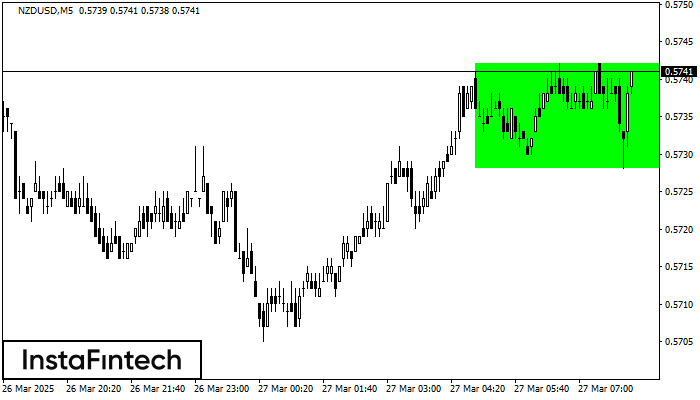
По торговому инструменту NZDUSD на M5 сформировалась фигура продолжения тренда - «Прямоугольник». Фигура имеет границы: Нижняя 0.5728; Верхняя 0.5742. В случае пробоя верхней границы вероятно дальнейшее движение в сторону тренда.
Таймфреймы М5 и М15 могут иметь больше ложных точек входа.
Смотрите также
- Все
- Вымпел
- Голова и плечи
- Двойная вершина
- Прямоугольник
- Треугольник
- Тройная вершина
- Флаг
- Все
- #AAPL
- #AMZN
- #Bitcoin
- #EBAY
- #FB
- #GOOG
- #INTC
- #KO
- #MA
- #MCD
- #MSFT
- #NTDOY
- #PEP
- #TSLA
- #TWTR
- AUDCAD
- AUDCHF
- AUDJPY
- AUDUSD
- EURCAD
- EURCHF
- EURGBP
- EURJPY
- EURNZD
- EURRUB
- EURUSD
- GBPAUD
- GBPCHF
- GBPJPY
- GBPUSD
- GOLD
- NZDCAD
- NZDCHF
- NZDJPY
- NZDUSD
- SILVER
- USDCAD
- USDCHF
- USDJPY
- USDRUB
- Все
- M5
- M15
- M30
- H1
- D1
- Все
- Покупка
- Продажа
- Все
- 1
- 2
- 3
- 4
- 5
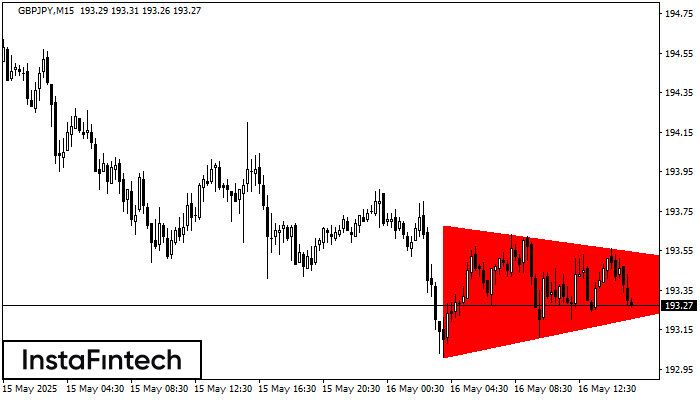
Berdasarkan carta M15, GBPJPY membentuk corak Segi Tiga Simetri Menurun. Penerangan: Sempadan yang lebih rendah ialah 193.01/193.41 dan sempadan atas adalah 193.68/193.41. Lebar corak diukur pada carta pada -67 pips
Carta masa M5 dan M15 mungkin mempunyai lebih banyak titik kemasukan palsu.
Open chart in a new window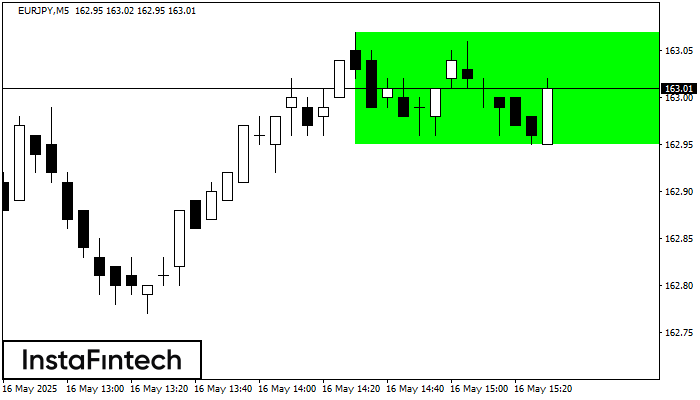
Berdasarkan carta M5, EURJPY telah membentuk Segi Empat Menaik. Jenis corak ini menunjukkan kesinambungan aliran. Ia terdiri daripada dua tahap: rintangan 163.07 dan sokongan 162.95. Sekiranya tahap rintangan 163.07
Carta masa M5 dan M15 mungkin mempunyai lebih banyak titik kemasukan palsu.
Open chart in a new window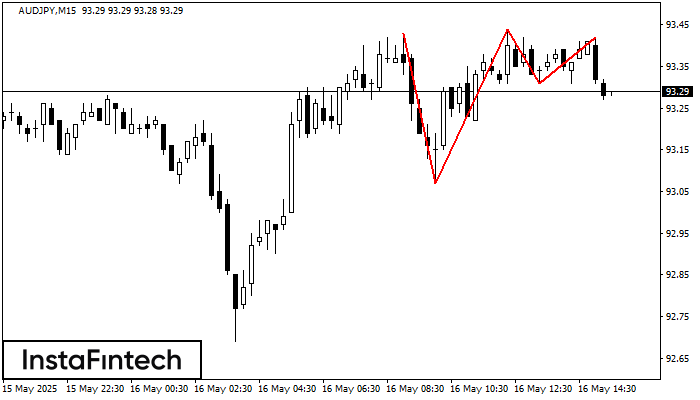
Corak Triple Top telah dibentuk pada carta AUDJPY M15. Ciri corak: sempadan mempunyai sudut menaik; garisan bawah corak mempunyai koordinat 93.07/93.31 dengan had atas 93.43/93.42; unjuran lebar ialah 36 mata
Carta masa M5 dan M15 mungkin mempunyai lebih banyak titik kemasukan palsu.
Open chart in a new window