GBP/USD
Analysis:
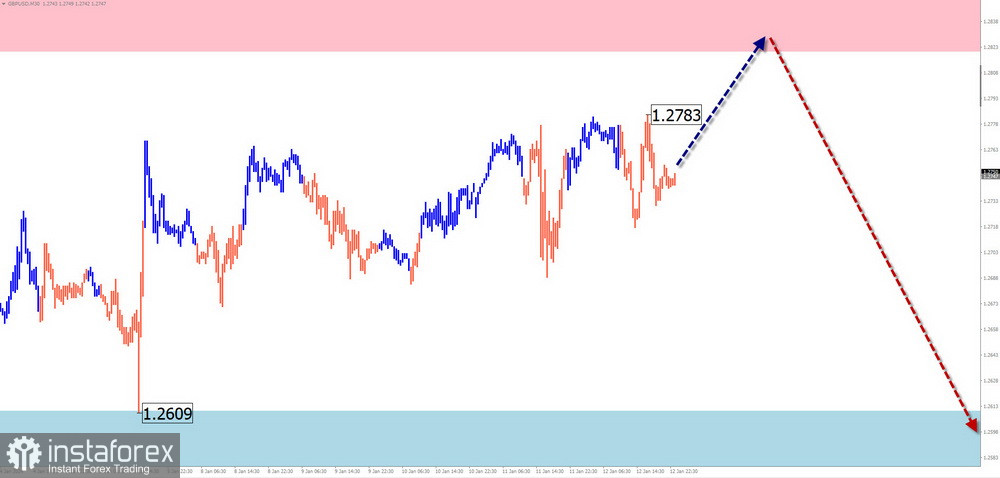
On the chart of the major British pound currency pair, the trend direction has been set by an ascending wave algorithm since October last year. The last segment of this wave, which has been correcting the main direction since late November, takes the form of a shifting plane. Its structure still needs to be completed. Quotes are trading in a narrow corridor between zones of opposing directions.
Forecast:
In the first half of the week, a sideways movement with an ascending vector is expected for the British pound. An increase in the exchange rate is possible but within the calculated resistance. Further, in this zone, one can expect increased volatility, a change in direction, and a return to the bearish direction.
Potential Reversal Zones
Resistance:
Support:
Recommendations:
Purchases: Have a limited potential and may result in losses.
Sales: After the appearance of confirmed reversal signals in the resistance area by your trading system, they may be used in trading transactions.
AUD/USD
Analysis:
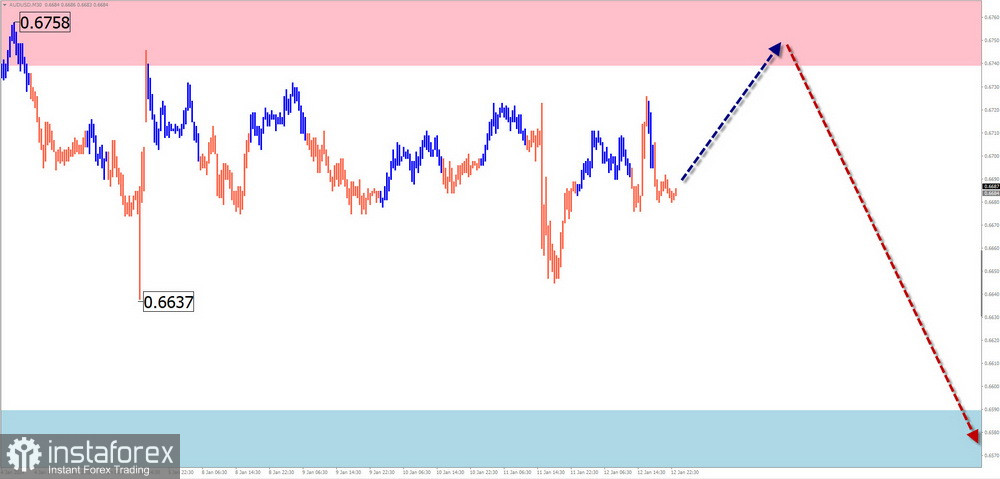
On the chart of the Australian currency in pairs against the US dollar, the most interesting feature is the unfinished ascending wave pattern from October 13th of last year. In its structure, the middle part (B) is nearing completion. On the chart, this segment looks like a stretched plane. Quotes of the pair are trapped between reversal potential zones of different timeframes.
Forecast:
Over the next few days, a general ascending vector is expected, with the price returning to the calculated resistance. After possible pressure on this zone, a reversal can be expected. The start of a bearish trend is likely by the end of the week. The decline is likely not beyond the support zone.
Potential Reversal Zones
Resistance:
Support:
Recommendations:
Purchases: Due to limited potential, they may result in losses.
Sales: After confirmed reversal signals appear in the resistance area, fractional lot sizes may be used in trading transactions.
USD/CHF
Analysis:
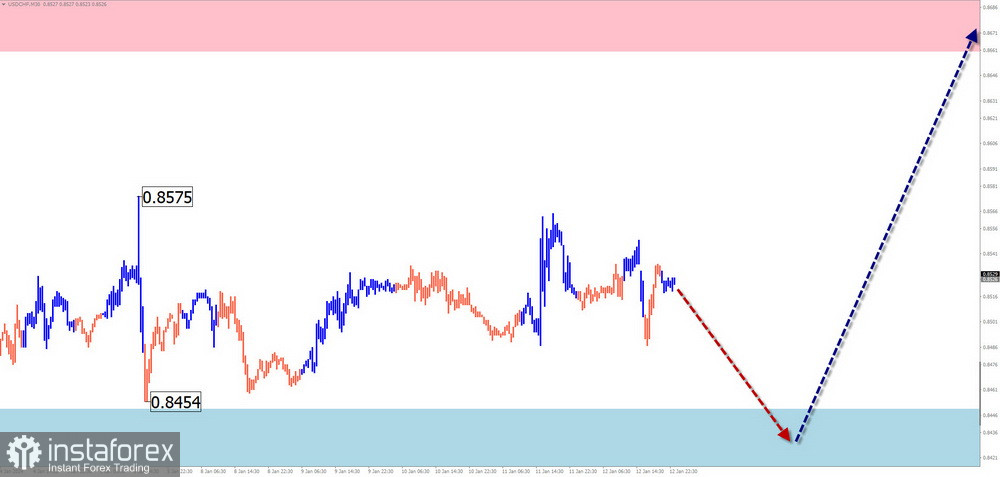
The quotes of the Swiss franc on the chart of the major pair continue to form a descending plane. In its structure, the final part (C) has been developing since the end of December. A horizontal correction has been forming within this segment for the past two months. The structure of this movement is not complete at the time of analysis.
Forecast:
In the upcoming week, the continuation of the overall sideways movement is expected. In the first few days, the completion of the descending sentiment can be expected. Afterward, a reversal and an upward movement are anticipated. When changing direction, a brief breakthrough of the lower boundary of the support zone cannot be ruled out.
Potential Reversal Zones
Resistance:
Support:
Recommendations:
Sales: There are no conditions for such transactions in the pair market.
Purchases: After confirmed reversal signals appear in the support area, they may be used in trading. It is safer to reduce the trading lot size.
EUR/JPY
Analysis:
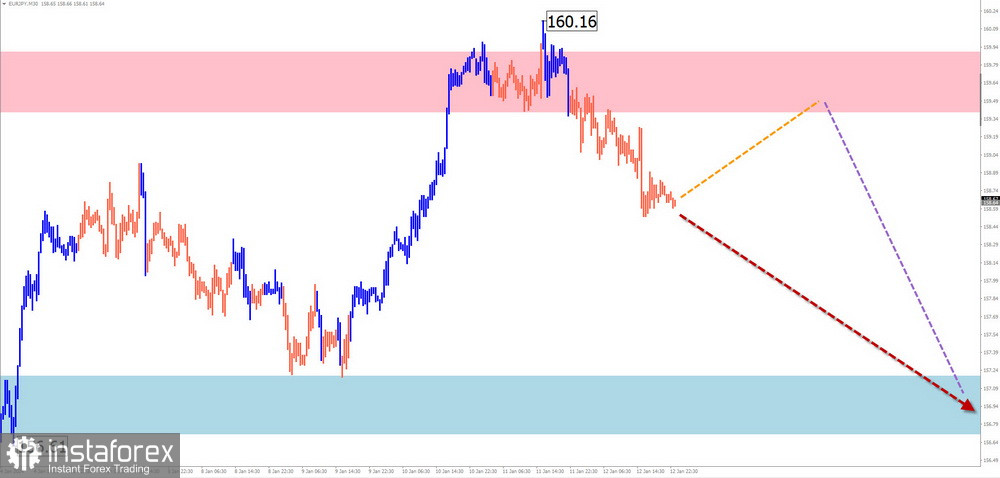
Since the end of December last year, an ascending wave structure has been developing on the chart of the euro/yen pair. This wave forms a new segment of the main trend on the weekly chart. Quotes have reached the lower boundary of a powerful potential reversal zone. There is a need for a correction in the structure.
Forecast:
Over the upcoming week, a continuation of the price decline is expected, with a decrease in the exchange rate to the calculated support. In the first couple of days, a short-term increase in price is not ruled out, but not beyond the calculated resistance.
Potential Reversal Zones
Resistance:
Support:
Recommendations:
Purchases: Due to expected limited potential, they may be risky.
Sales: After confirmed reversal signals appear in the support area, they may be used to execute transactions.
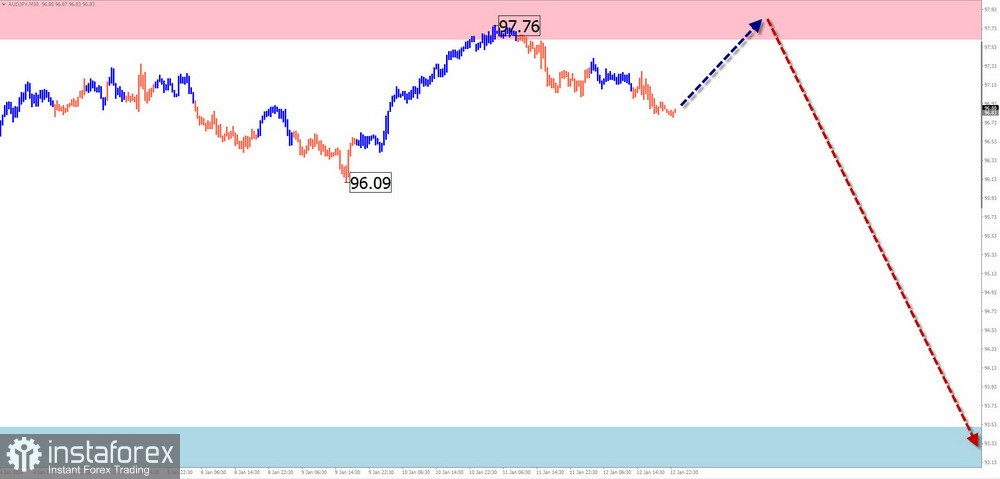
AUD/JPY
Brief Analysis:
The trend of the Australian dollar/Japanese yen pair has increased in recent years. The unfinished segment in the short-term perspective is a correction, counting from the middle of June of last year. Its structure is nearing completion at the time of analysis. Quotes of the pair are caught between potential reversal levels of different scales.
Weekly Forecast:
Over the next couple of days, a renewed pressure on the resistance zone is possible. In the second half of the week, a reversal formation and a downward price movement can be expected, potentially down to support levels.
Potential Reversal Zones
Resistance:
Support:
Recommendations:
Purchases: Have limited potential and may result in losses.
Sales: This will be possible after confirmed reversal signals appear in the resistance area.
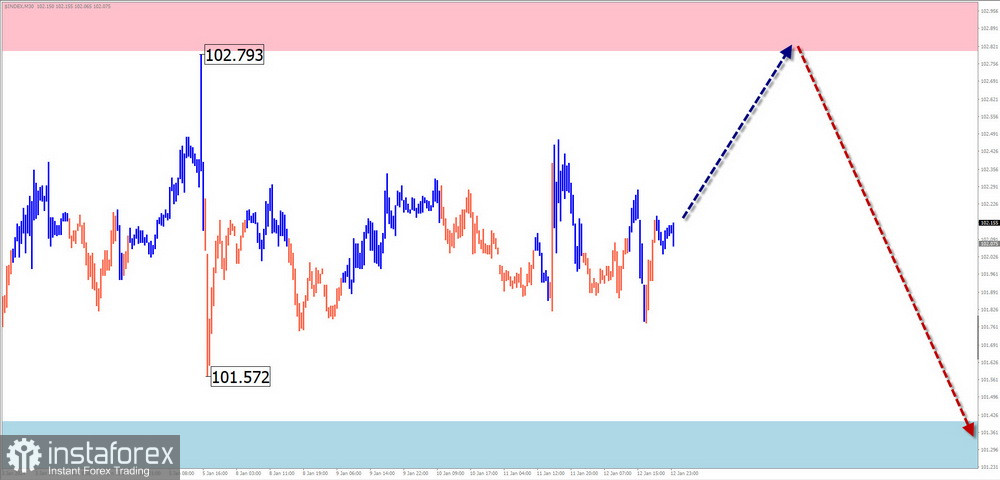
US Dollar Index
Brief Analysis:
On the US Dollar Index chart, the descending wave that began in October of last year continues to dominate. Since mid-December, quotes have been corrected, forming an elongated plane. The structure of this correction is not complete at the time of analysis.
Weekly Forecast:
In the upcoming weekly period, a continuation of the overall sideways movement of the index is expected. In the first few days, a short-term rebound in resistance cannot be ruled out. A downward vector is more likely closer to the weekend.
Potential Reversal Zones
Resistance:
Support:
Recommendations:
There are no conditions for buying the US dollar in the coming week. During the weakening of the dollar's positions, profitable trades will strengthen the positions of national currencies in major pairs.
Explanations: In simplified wave analysis (SWA), all waves consist of 3 parts (A-B-C). The analysis focuses on the latest unfinished wave in each timeframe. Dashed lines indicate expected movements.
Note: The wave algorithm does not consider the duration of instrument movements in time!