


signal strength 1 of 5
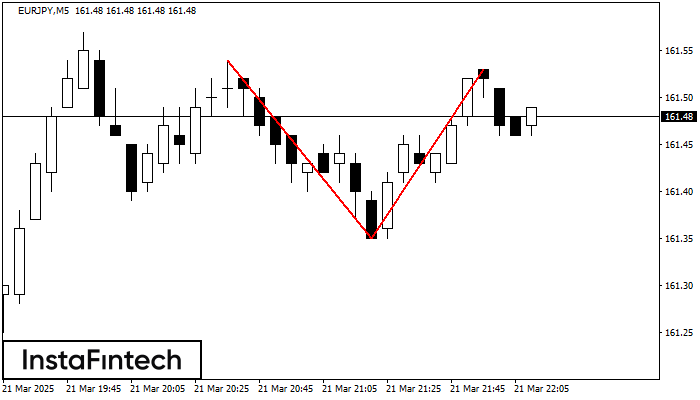
The Double Top reversal pattern has been formed on EURJPY M5. Characteristics: the upper boundary 161.54; the lower boundary 161.35; the width of the pattern is 18 points. Sell trades are better to be opened below the lower boundary 161.35 with a possible movements towards the 161.20 level.
The M5 and M15 time frames may have more false entry points.
Juga lihat
- All
- Double Top
- Flag
- Head and Shoulders
- Pennant
- Rectangle
- Triangle
- Triple top
- All
- #AAPL
- #AMZN
- #Bitcoin
- #EBAY
- #FB
- #GOOG
- #INTC
- #KO
- #MA
- #MCD
- #MSFT
- #NTDOY
- #PEP
- #TSLA
- #TWTR
- AUDCAD
- AUDCHF
- AUDJPY
- AUDUSD
- EURCAD
- EURCHF
- EURGBP
- EURJPY
- EURNZD
- EURRUB
- EURUSD
- GBPAUD
- GBPCHF
- GBPJPY
- GBPUSD
- GOLD
- NZDCAD
- NZDCHF
- NZDJPY
- NZDUSD
- SILVER
- USDCAD
- USDCHF
- USDJPY
- USDRUB
- All
- M5
- M15
- M30
- H1
- D1
- All
- Buy
- Sale
- All
- 1
- 2
- 3
- 4
- 5
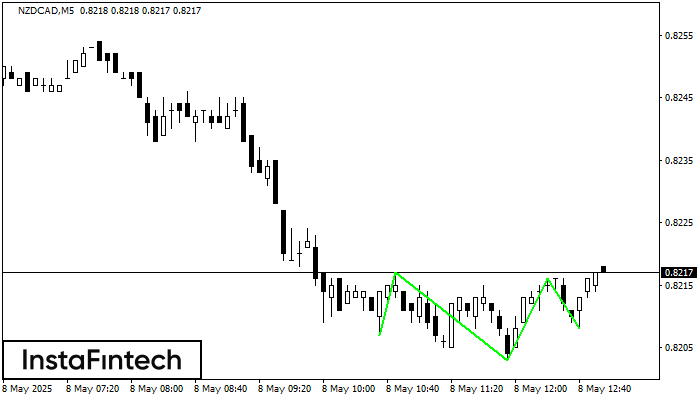
M5 के अनुसार, NZDCAD तकनीकी पैटर्न - इन्वर्स हेड एण्ड शोल्डर्स को आकार दे रहा है। यदि नेकलाइन 0.8217/0.8216 टूट जाती है, तो इंस्ट्रूमेंट के 0.8231 की ओर बढ़ने की
M5 और M15 समय सीमा में अधिक फाल्स एंट्री पॉइंट्स हो सकते हैं।
Open chart in a new window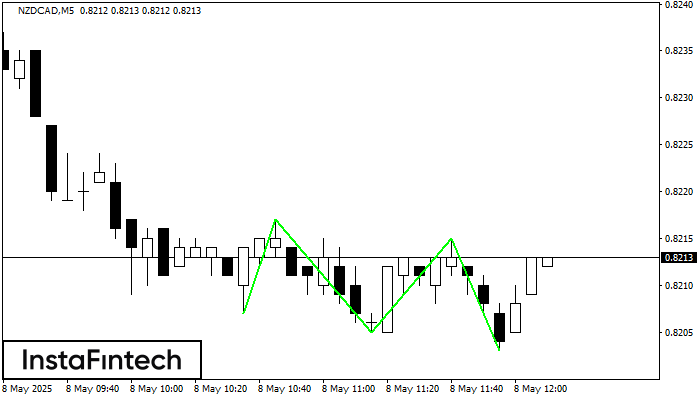
ट्रिपल बॉटम पैटर्न NZDCAD M5 के चार्ट पर बना है। पैटर्न की विशेषताएं: पैटर्न की निचली रेखा 0.8217 पर है जिसकी ऊपरी सीमा 0.8217/0.8215 है, प्रक्षेपण की चौड़ाई 10 पॉइंट्स
M5 और M15 समय सीमा में अधिक फाल्स एंट्री पॉइंट्स हो सकते हैं।
Open chart in a new window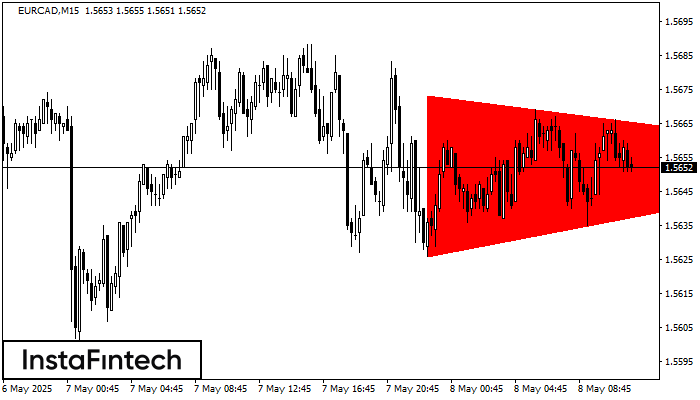
M15 के चार्ट के अनुसार, EURCAD से बियरिश सिमेट्रिकल त्रिभुज पैटर्न बना। निचली सीमा 1.5626 भंग होने की स्थिति में यह पैटर्न और नीचे के ट्रेंड की ओर संकेत करता
M5 और M15 समय सीमा में अधिक फाल्स एंट्री पॉइंट्स हो सकते हैं।
Open chart in a new window


