


signal strength 1 of 5

According to the chart of M5, AUDUSD formed the Bullish Symmetrical Triangle pattern, which signals the trend will continue. Description. The upper border of the pattern touches the coordinates 0.6295/0.6288 whereas the lower border goes across 0.6279/0.6288. The pattern width is measured on the chart at 16 pips. If the Bullish Symmetrical Triangle pattern is in progress during the upward trend, this indicates the current trend will go on. In case 0.6288 is broken, the price could continue its move toward 0.6303.
The M5 and M15 time frames may have more false entry points.
- All
- Double Top
- Flag
- Head and Shoulders
- Pennant
- Rectangle
- Triangle
- Triple top
- All
- #AAPL
- #AMZN
- #Bitcoin
- #EBAY
- #FB
- #GOOG
- #INTC
- #KO
- #MA
- #MCD
- #MSFT
- #NTDOY
- #PEP
- #TSLA
- #TWTR
- AUDCAD
- AUDCHF
- AUDJPY
- AUDUSD
- EURCAD
- EURCHF
- EURGBP
- EURJPY
- EURNZD
- EURRUB
- EURUSD
- GBPAUD
- GBPCHF
- GBPJPY
- GBPUSD
- GOLD
- NZDCAD
- NZDCHF
- NZDJPY
- NZDUSD
- SILVER
- USDCAD
- USDCHF
- USDJPY
- USDRUB
- All
- M5
- M15
- M30
- H1
- D1
- All
- Buy
- Sale
- All
- 1
- 2
- 3
- 4
- 5
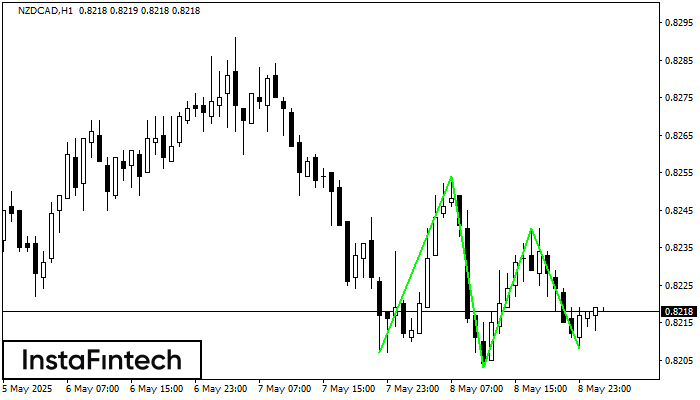
Corak Triple Bottom telah dibentuk pada carta NZDCAD H1. Ciri-ciri corak: Garisan bawah corak mempunyai koordinat 0.8254 dengan had atas 0.8254/0.8240, unjuran lebar adalah 47 mata. Pembentukan corak Triple Bottom
Open chart in a new window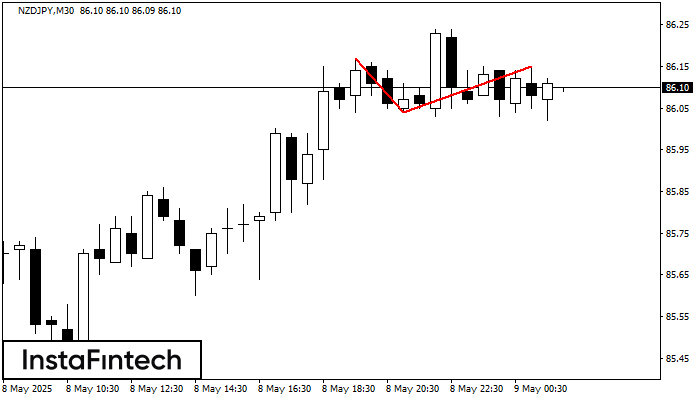
Corak pembalikan Double Top telah dibentuk pada NZDJPY M30. Ciri-ciri: sempadan atas %P0.000000; sempadan bawah 86.17; sempadan bawah 86.04; lebar corak adalah 11 mata. Dagangan menjual adalah lebih baik untuk
Open chart in a new window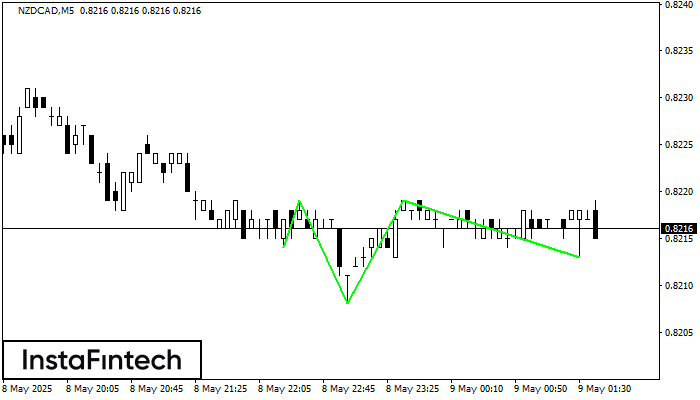
Berdasarkan carta M5, NZDCAD membentuk corak Inverse Head dan Shoulder. Bahagian atas Head ditetapkan pada 0.8219 manakala garisan median Neck didapati pada 0.8208/0.8213. Pembentukan corak Inverse Head dan Shoulder jelas
Carta masa M5 dan M15 mungkin mempunyai lebih banyak titik kemasukan palsu.
Open chart in a new window


