

signal strength 1 of 5
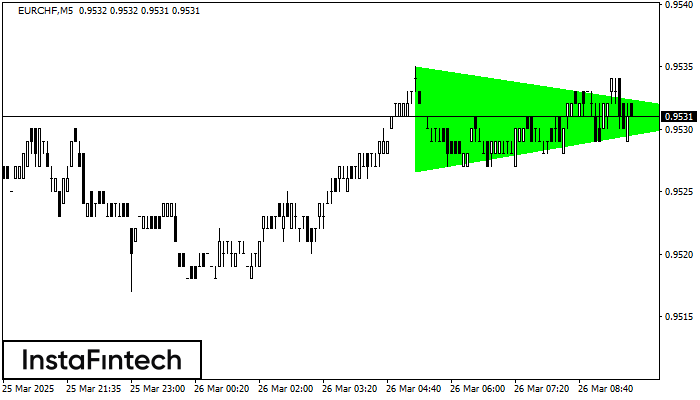
According to the chart of M5, EURCHF formed the Bullish Symmetrical Triangle pattern, which signals the trend will continue. Description. The upper border of the pattern touches the coordinates 0.9535/0.9531 whereas the lower border goes across 0.9527/0.9531. The pattern width is measured on the chart at 8 pips. If the Bullish Symmetrical Triangle pattern is in progress during the upward trend, this indicates the current trend will go on. In case 0.9531 is broken, the price could continue its move toward 0.9546.
The M5 and M15 time frames may have more false entry points.
- All
- Double Top
- Flag
- Head and Shoulders
- Pennant
- Rectangle
- Triangle
- Triple top
- All
- #AAPL
- #AMZN
- #Bitcoin
- #EBAY
- #FB
- #GOOG
- #INTC
- #KO
- #MA
- #MCD
- #MSFT
- #NTDOY
- #PEP
- #TSLA
- #TWTR
- AUDCAD
- AUDCHF
- AUDJPY
- AUDUSD
- EURCAD
- EURCHF
- EURGBP
- EURJPY
- EURNZD
- EURRUB
- EURUSD
- GBPAUD
- GBPCHF
- GBPJPY
- GBPUSD
- GOLD
- NZDCAD
- NZDCHF
- NZDJPY
- NZDUSD
- SILVER
- USDCAD
- USDCHF
- USDJPY
- USDRUB
- All
- M5
- M15
- M30
- H1
- D1
- All
- Buy
- Sale
- All
- 1
- 2
- 3
- 4
- 5
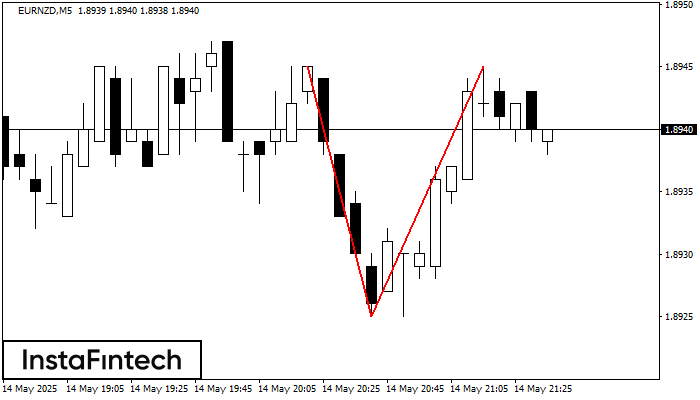
По EURNZD на M5 сформировалась разворотная фигура «Двойная вершина». Характеристика: Верхняя граница 1.8945; Нижняя граница 1.8925; Ширина фигуры 20 пунктов. Позицию на продажу возможно открыть ниже нижней границы 1.8925
Таймфреймы М5 и М15 могут иметь больше ложных точек входа.
Открыть график инструмента в новом окне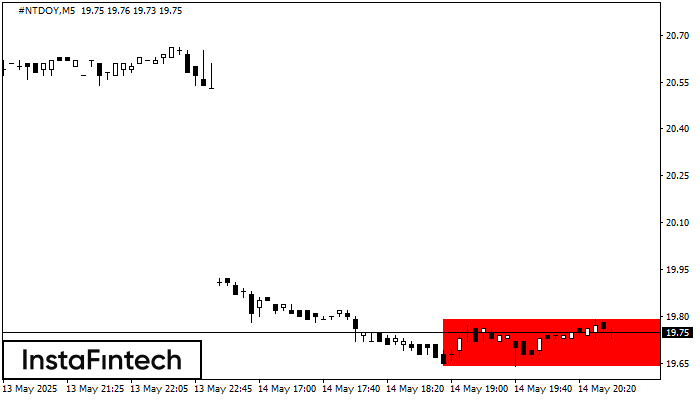
Сформирована фигура «Прямоугольник» на графике #NTDOY M5. Тип фигуры: Продолжение тренда; Границы: Верхняя 19.79, Нижняя 19.64; Сигнал: позиция на продажу открывается после фиксации цены ниже границы прямоугольника 19.64
Таймфреймы М5 и М15 могут иметь больше ложных точек входа.
Открыть график инструмента в новом окне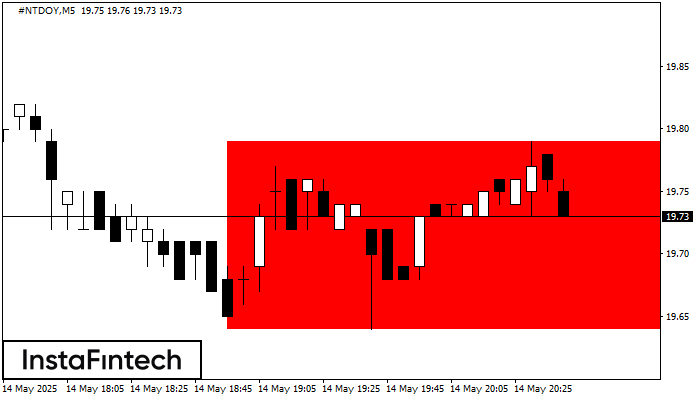
Сформирована фигура «Прямоугольник» на графике #NTDOY M5. Тип фигуры: Продолжение тренда; Границы: Верхняя 19.79, Нижняя 19.64; Сигнал: позиция на продажу открывается после фиксации цены ниже границы прямоугольника 19.64
Таймфреймы М5 и М15 могут иметь больше ложных точек входа.
Открыть график инструмента в новом окне


