

signal strength 2 of 5
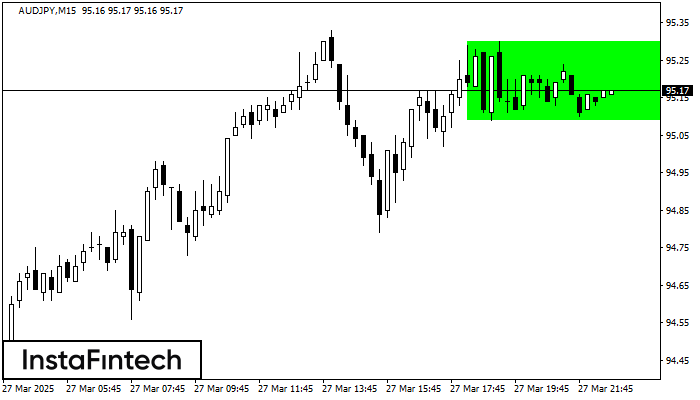
According to the chart of M15, AUDJPY formed the Bullish Rectangle. The pattern indicates a trend continuation. The upper border is 95.30, the lower border is 95.09. The signal means that a long position should be opened above the upper border 95.30 of the Bullish Rectangle.
The M5 and M15 time frames may have more false entry points.
Juga lihat
- All
- Double Top
- Flag
- Head and Shoulders
- Pennant
- Rectangle
- Triangle
- Triple top
- All
- #AAPL
- #AMZN
- #Bitcoin
- #EBAY
- #FB
- #GOOG
- #INTC
- #KO
- #MA
- #MCD
- #MSFT
- #NTDOY
- #PEP
- #TSLA
- #TWTR
- AUDCAD
- AUDCHF
- AUDJPY
- AUDUSD
- EURCAD
- EURCHF
- EURGBP
- EURJPY
- EURNZD
- EURRUB
- EURUSD
- GBPAUD
- GBPCHF
- GBPJPY
- GBPUSD
- GOLD
- NZDCAD
- NZDCHF
- NZDJPY
- NZDUSD
- SILVER
- USDCAD
- USDCHF
- USDJPY
- USDRUB
- All
- M5
- M15
- M30
- H1
- D1
- All
- Buy
- Sale
- All
- 1
- 2
- 3
- 4
- 5
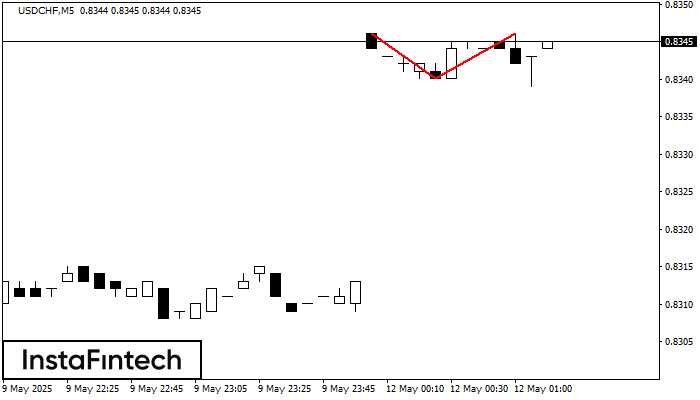
ในชาร์ตของ USDCHF M5 พบว่า กราฟรูปแบบย้อนกลับ รูปแบบกราฟจุดสองยอด (Double Top) ได้ถูกสร้างขึ้นมา คุณลักษณะ: ขอบเขตด้านบน 0.8346; ขอบเขตด้านล่าง 0.8340; ความกว้างของกราฟรูปแบบนี้คือ
ขอบเตระยะเวลาใน M5 และ M15 อาจจะมีตำแหน่งการเข้าใช้งานที่ผิดพลาดมากยิ่งขึ้น
Open chart in a new windowwas formed on 11.05 at 23:55:31 (UTC+0)
signal strength 1 of 5
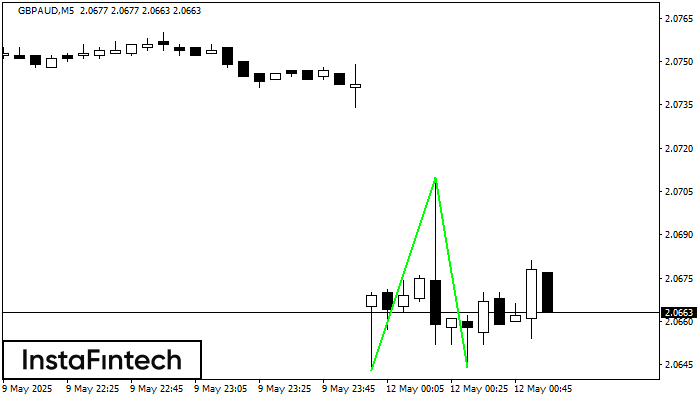
รูปแบบ รูปแบบกราฟจุดสองยอดขาลง (Double Bottom) ถูกสร้างขึ้นมาใน GBPAUD M5 คุณลักษณะ: ระดับของแนวรับ 2.0643; ระดับของแนวต้าน 2.0710; ความกว้างของรูปแบบ 67 จุด
ขอบเตระยะเวลาใน M5 และ M15 อาจจะมีตำแหน่งการเข้าใช้งานที่ผิดพลาดมากยิ่งขึ้น
Open chart in a new window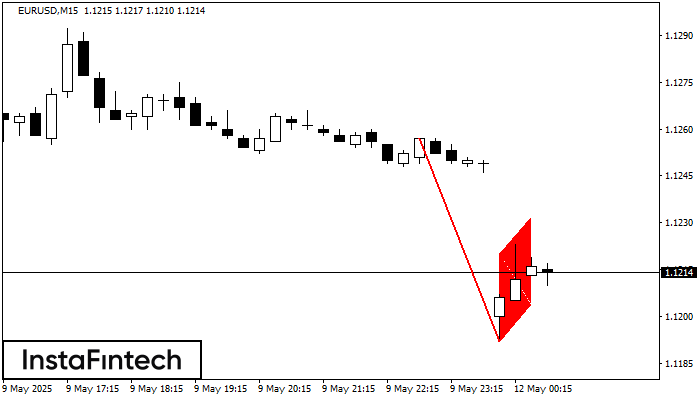
รูปแบบ รูปแบบกราฟธงขาลง (Bearish Flag) ได้สร้างขึ้นมาในชาร์ต EURUSD M15 ซึ่งแสดงให้เห็นว่า แนวโน้มขาลงยังคงจะเกิดขึ้นต่อไป ถ้าราคาเคลื่อนตัวทะลุผ่านลงไปต่ำกว่าระดับต่ำที่ 1.1192 มันก็อาจจะมีการเคลื่อนตัวลงด้านล่างต่อไป ราคาอาจจะเคลื่อนตัวตามจำนวนของจุด ซึ่งจะเท่ากับระยะความยาวของเสาธง(15 จุด)
ขอบเตระยะเวลาใน M5 และ M15 อาจจะมีตำแหน่งการเข้าใช้งานที่ผิดพลาดมากยิ่งขึ้น
Open chart in a new window


