

signal strength 4 of 5

The Triple Top pattern has formed on the chart of the EURJPY H1. Features of the pattern: borders have an ascending angle; the lower line of the pattern has the coordinates 161.49/162.07 with the upper limit 163.10/163.14; the projection of the width is 161 points. The formation of the Triple Top figure most likely indicates a change in the trend from upward to downward. This means that in the event of a breakdown of the support level of 161.49, the price is most likely to continue the downward movement.
Juga lihat
- All
- Double Top
- Flag
- Head and Shoulders
- Pennant
- Rectangle
- Triangle
- Triple top
- All
- #AAPL
- #AMZN
- #Bitcoin
- #EBAY
- #FB
- #GOOG
- #INTC
- #KO
- #MA
- #MCD
- #MSFT
- #NTDOY
- #PEP
- #TSLA
- #TWTR
- AUDCAD
- AUDCHF
- AUDJPY
- AUDUSD
- EURCAD
- EURCHF
- EURGBP
- EURJPY
- EURNZD
- EURRUB
- EURUSD
- GBPAUD
- GBPCHF
- GBPJPY
- GBPUSD
- GOLD
- NZDCAD
- NZDCHF
- NZDJPY
- NZDUSD
- SILVER
- USDCAD
- USDCHF
- USDJPY
- USDRUB
- All
- M5
- M15
- M30
- H1
- D1
- All
- Buy
- Sale
- All
- 1
- 2
- 3
- 4
- 5
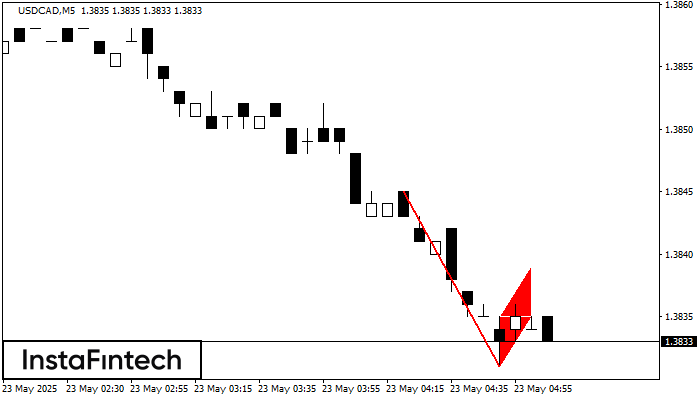
Corak Flag Aliran Menurun telah dibentuk pada carta USDCAD M5 yang memberi isyarat bahawa aliran menurun akan berterusan. Sekiranya harga menembusi di bawah paras yang rendah pada 1.3831, maka kemungkinan
Carta masa M5 dan M15 mungkin mempunyai lebih banyak titik kemasukan palsu.
Open chart in a new window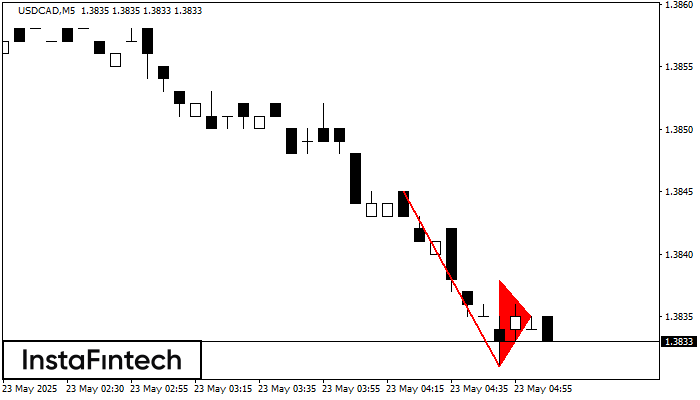
Corak Pennant Aliran Menurun telah dibentuk pada carta USDCAD M5. Jenis corak ini dicirikan oleh sedikit penurunan di mana selepas itu harga akan bergerak ke arah aliran asal. Sekiranya harga
Carta masa M5 dan M15 mungkin mempunyai lebih banyak titik kemasukan palsu.
Open chart in a new window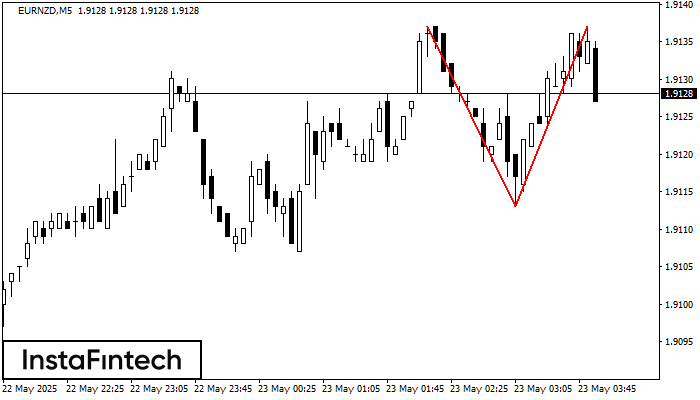
Corak Double Top telah dibentuk pada EURNZD M5. Isyarat bahawa aliran telah berubah dari aliran menaik ke aliran menurun. Mungkin, sekiranya asas corak 1.9113 ditembusi, pergerakan menurun akan berterusan
Carta masa M5 dan M15 mungkin mempunyai lebih banyak titik kemasukan palsu.
Open chart in a new window


