

signal strength 3 of 5

The Triple Bottom pattern has formed on the chart of AUDCHF M30. Features of the pattern: The lower line of the pattern has coordinates 0.5232 with the upper limit 0.5232/0.5218, the projection of the width is 26 points. The formation of the Triple Bottom pattern most likely indicates a change in the trend from downward to upward. This means that in the event of a breakdown of the resistance level 0.5206, the price is most likely to continue the upward movement.
- All
- Double Top
- Flag
- Head and Shoulders
- Pennant
- Rectangle
- Triangle
- Triple top
- All
- #AAPL
- #AMZN
- #Bitcoin
- #EBAY
- #FB
- #GOOG
- #INTC
- #KO
- #MA
- #MCD
- #MSFT
- #NTDOY
- #PEP
- #TSLA
- #TWTR
- AUDCAD
- AUDCHF
- AUDJPY
- AUDUSD
- EURCAD
- EURCHF
- EURGBP
- EURJPY
- EURNZD
- EURRUB
- EURUSD
- GBPAUD
- GBPCHF
- GBPJPY
- GBPUSD
- GOLD
- NZDCAD
- NZDCHF
- NZDJPY
- NZDUSD
- SILVER
- USDCAD
- USDCHF
- USDJPY
- USDRUB
- All
- M5
- M15
- M30
- H1
- D1
- All
- Buy
- Sale
- All
- 1
- 2
- 3
- 4
- 5
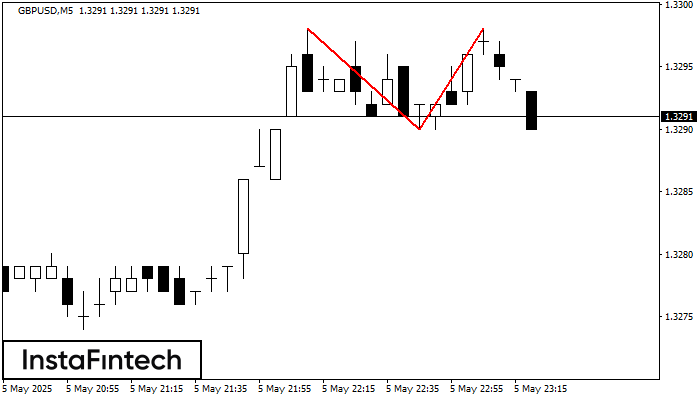
Corak pembalikan Double Top telah dibentuk pada GBPUSD M5. Ciri-ciri: sempadan atas %P0.000000; sempadan bawah 1.3298; sempadan bawah 1.3290; lebar corak adalah 8 mata. Dagangan menjual adalah lebih baik untuk
Carta masa M5 dan M15 mungkin mempunyai lebih banyak titik kemasukan palsu.
Open chart in a new window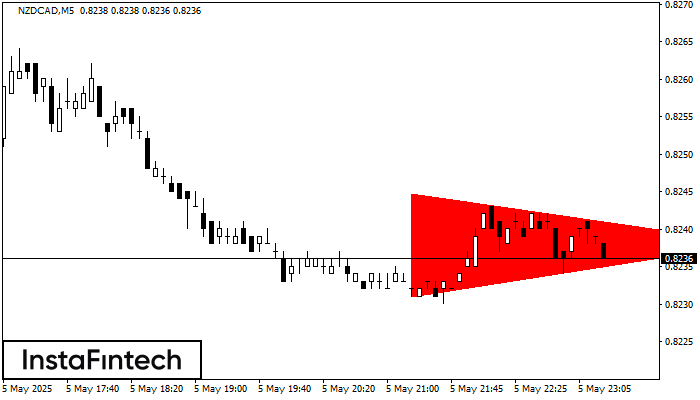
Berdasarkan carta M5, NZDCAD membentuk corak Segi Tiga Simetri Menurun. Corak ini menandakan aliran menurun lagi dalam situasi sempadan rendah 0.8231 ditembusi. Di sini, keuntungan andaian akan sepadan dengan lebar
Carta masa M5 dan M15 mungkin mempunyai lebih banyak titik kemasukan palsu.
Open chart in a new window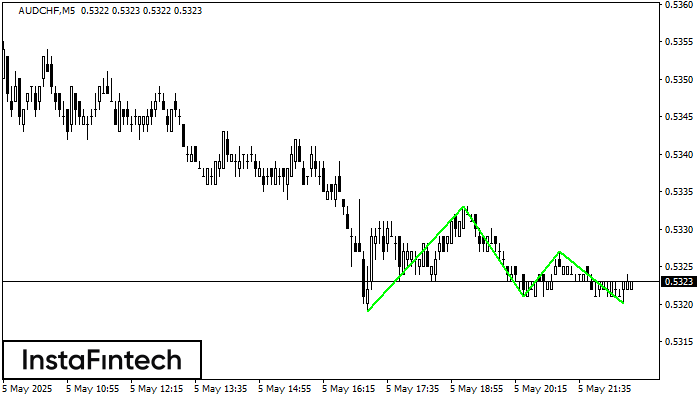
Corak Triple Bottom telah dibentuk pada carta AUDCHF M5. Ciri-ciri corak: Garisan bawah corak mempunyai koordinat 0.5333 dengan had atas 0.5333/0.5327, unjuran lebar adalah 14 mata. Pembentukan corak Triple Bottom
Carta masa M5 dan M15 mungkin mempunyai lebih banyak titik kemasukan palsu.
Open chart in a new window


