

signal strength 1 of 5
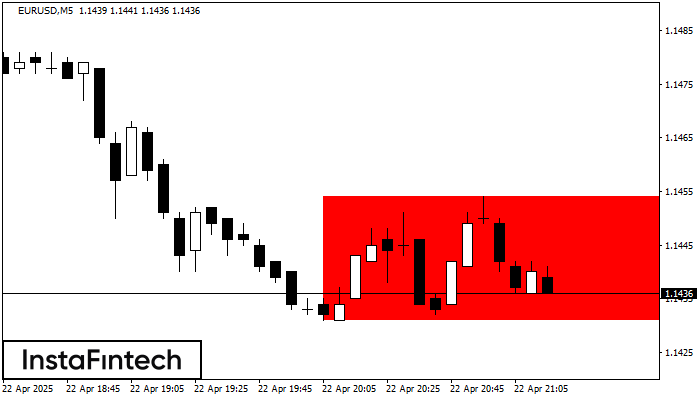
According to the chart of M5, EURUSD formed the Bearish Rectangle. The pattern indicates a trend continuation. The upper border is 1.1454, the lower border is 1.1431. The signal means that a short position should be opened after fixing a price below the lower border 1.1431 of the Bearish Rectangle.
The M5 and M15 time frames may have more false entry points.
Juga lihat
- All
- Double Top
- Flag
- Head and Shoulders
- Pennant
- Rectangle
- Triangle
- Triple top
- All
- #AAPL
- #AMZN
- #Bitcoin
- #EBAY
- #FB
- #GOOG
- #INTC
- #KO
- #MA
- #MCD
- #MSFT
- #NTDOY
- #PEP
- #TSLA
- #TWTR
- AUDCAD
- AUDCHF
- AUDJPY
- AUDUSD
- EURCAD
- EURCHF
- EURGBP
- EURJPY
- EURNZD
- EURRUB
- EURUSD
- GBPAUD
- GBPCHF
- GBPJPY
- GBPUSD
- GOLD
- NZDCAD
- NZDCHF
- NZDJPY
- NZDUSD
- SILVER
- USDCAD
- USDCHF
- USDJPY
- USDRUB
- All
- M5
- M15
- M30
- H1
- D1
- All
- Buy
- Sale
- All
- 1
- 2
- 3
- 4
- 5
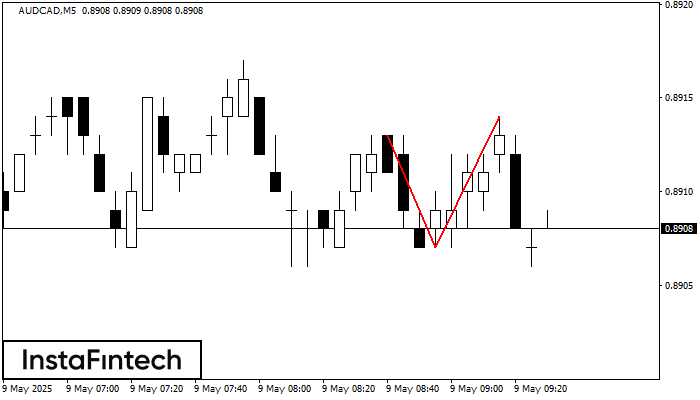
The Double Top pattern has been formed on AUDCAD M5. It signals that the trend has been changed from upwards to downwards. Probably, if the base of the pattern 0.8907
The M5 and M15 time frames may have more false entry points.
Open chart in a new window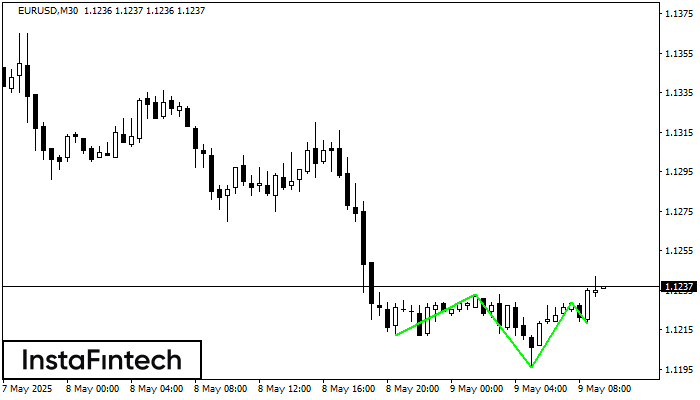
According to M30, EURUSD is shaping the technical pattern – the Inverse Head and Shoulder. In case the Neckline 1.1233/1.1229 is broken out, the instrument is likely to move toward
Open chart in a new window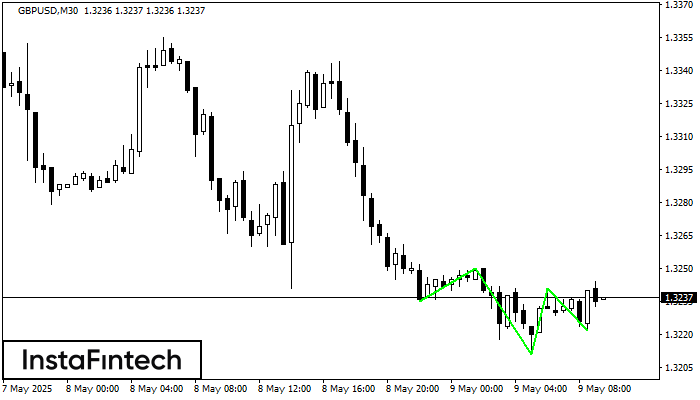
According to the chart of M30, GBPUSD produced the pattern termed the Inverse Head and Shoulder. The Head is fixed at 1.3211 while the median line of the Neck
Open chart in a new window


