

signal strength 4 of 5
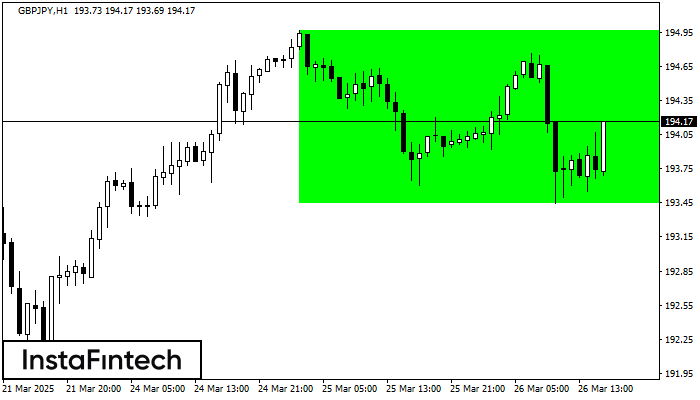
According to the chart of H1, GBPJPY formed the Bullish Rectangle which is a pattern of a trend continuation. The pattern is contained within the following borders: the lower border 193.44 – 193.44 and upper border 194.97 – 194.97. In case the upper border is broken, the instrument is likely to follow the upward trend.
See Also
- All
- Double Top
- Flag
- Head and Shoulders
- Pennant
- Rectangle
- Triangle
- Triple top
- All
- #AAPL
- #AMZN
- #Bitcoin
- #EBAY
- #FB
- #GOOG
- #INTC
- #KO
- #MA
- #MCD
- #MSFT
- #NTDOY
- #PEP
- #TSLA
- #TWTR
- AUDCAD
- AUDCHF
- AUDJPY
- AUDUSD
- EURCAD
- EURCHF
- EURGBP
- EURJPY
- EURNZD
- EURRUB
- EURUSD
- GBPAUD
- GBPCHF
- GBPJPY
- GBPUSD
- GOLD
- NZDCAD
- NZDCHF
- NZDJPY
- NZDUSD
- SILVER
- USDCAD
- USDCHF
- USDJPY
- USDRUB
- All
- M5
- M15
- M30
- H1
- D1
- All
- Buy
- Sale
- All
- 1
- 2
- 3
- 4
- 5

The Triple Bottom pattern has formed on the chart of the #Bitcoin M15 trading instrument. The pattern signals a change in the trend from downwards to upwards in the case
The M5 and M15 time frames may have more false entry points.
Открыть график инструмента в новом окне
The Double Top pattern has been formed on AUDUSD M5. It signals that the trend has been changed from upwards to downwards. Probably, if the base of the pattern 0.6399
The M5 and M15 time frames may have more false entry points.
Открыть график инструмента в новом окне
On the chart of GBPUSD M15 the Double Top reversal pattern has been formed. Characteristics: the upper boundary 1.3332; the lower boundary 1.3315; the width of the pattern 17 points
The M5 and M15 time frames may have more false entry points.
Открыть график инструмента в новом окне


