


signal strength 2 of 5
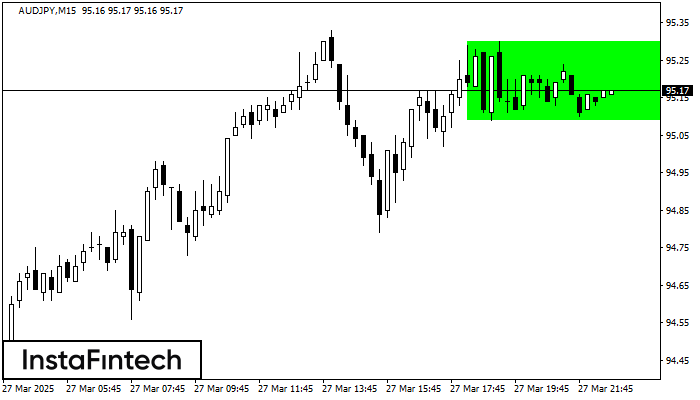
According to the chart of M15, AUDJPY formed the Bullish Rectangle. The pattern indicates a trend continuation. The upper border is 95.30, the lower border is 95.09. The signal means that a long position should be opened above the upper border 95.30 of the Bullish Rectangle.
The M5 and M15 time frames may have more false entry points.
- All
- Double Top
- Flag
- Head and Shoulders
- Pennant
- Rectangle
- Triangle
- Triple top
- All
- #AAPL
- #AMZN
- #Bitcoin
- #EBAY
- #FB
- #GOOG
- #INTC
- #KO
- #MA
- #MCD
- #MSFT
- #NTDOY
- #PEP
- #TSLA
- #TWTR
- AUDCAD
- AUDCHF
- AUDJPY
- AUDUSD
- EURCAD
- EURCHF
- EURGBP
- EURJPY
- EURNZD
- EURRUB
- EURUSD
- GBPAUD
- GBPCHF
- GBPJPY
- GBPUSD
- GOLD
- NZDCAD
- NZDCHF
- NZDJPY
- NZDUSD
- SILVER
- USDCAD
- USDCHF
- USDJPY
- USDRUB
- All
- M5
- M15
- M30
- H1
- D1
- All
- Buy
- Sale
- All
- 1
- 2
- 3
- 4
- 5

According to the chart of M15, #TSLA formed the Bearish Symmetrical Triangle pattern. This pattern signals a further downward trend in case the lower border 322.39 is breached. Here
The M5 and M15 time frames may have more false entry points.
Open chart in a new window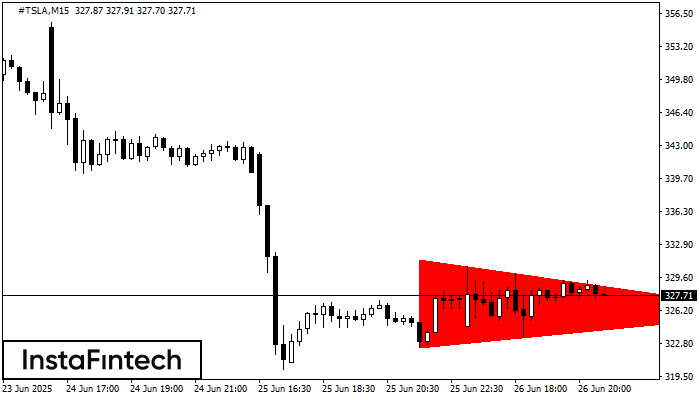
According to the chart of M15, #TSLA formed the Bearish Symmetrical Triangle pattern. Trading recommendations: A breach of the lower border 322.39 is likely to encourage a continuation
The M5 and M15 time frames may have more false entry points.
Open chart in a new window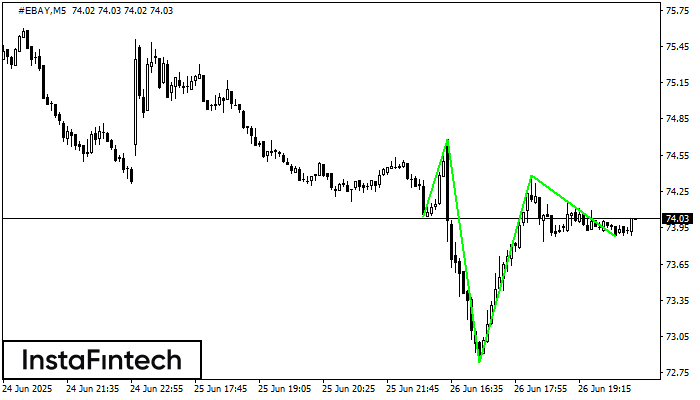
According to the chart of M5, #EBAY produced the pattern termed the Inverse Head and Shoulder. The Head is fixed at 72.84 while the median line of the Neck
The M5 and M15 time frames may have more false entry points.
Open chart in a new window


