

signal strength 1 of 5
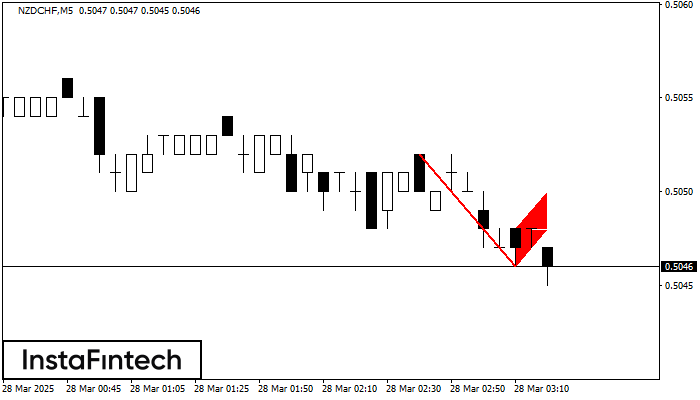
The Bearish Flag pattern has been formed on the chart NZDCHF M5. Therefore, the downwards trend is likely to continue in the nearest term. As soon as the price breaks below the low at 0.5046, traders should enter the market.
The M5 and M15 time frames may have more false entry points.
- All
- Double Top
- Flag
- Head and Shoulders
- Pennant
- Rectangle
- Triangle
- Triple top
- All
- #AAPL
- #AMZN
- #Bitcoin
- #EBAY
- #FB
- #GOOG
- #INTC
- #KO
- #MA
- #MCD
- #MSFT
- #NTDOY
- #PEP
- #TSLA
- #TWTR
- AUDCAD
- AUDCHF
- AUDJPY
- AUDUSD
- EURCAD
- EURCHF
- EURGBP
- EURJPY
- EURNZD
- EURRUB
- EURUSD
- GBPAUD
- GBPCHF
- GBPJPY
- GBPUSD
- GOLD
- NZDCAD
- NZDCHF
- NZDJPY
- NZDUSD
- SILVER
- USDCAD
- USDCHF
- USDJPY
- USDRUB
- All
- M5
- M15
- M30
- H1
- D1
- All
- Buy
- Sale
- All
- 1
- 2
- 3
- 4
- 5

Según el gráfico de M5, EURUSD formó el Rectángulo Bajista. Este tipo de patrón indica la continuación de una tendencia. Esto consiste de dos niveles: resistencia 1.1308 - 0.0000
Los marcos de tiempo M5 y M15 pueden tener más puntos de entrada falsos.
Open chart in a new window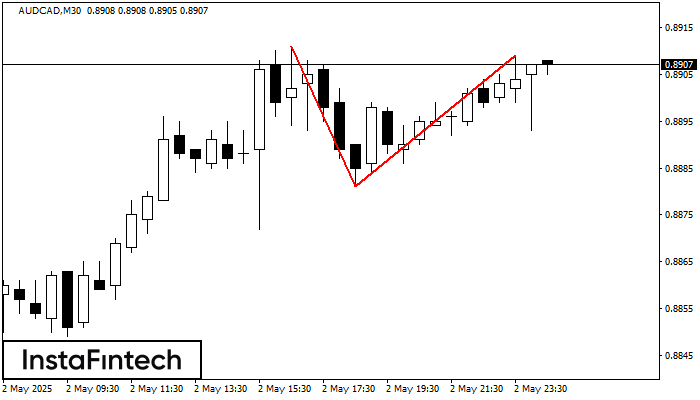
El patrón Doble Techo ha sido formado en AUDCAD M30. Esto señala que la tendencia ha sido cambiada de alcista a bajista. Probablemente, si la base del patrón 0.8881
Open chart in a new window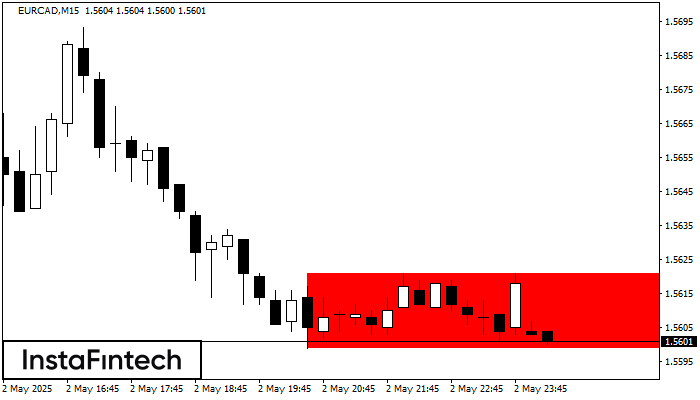
Según el gráfico de M15, EURCAD formó el Rectángulo Bajista. Este tipo de patrón indica la continuación de una tendencia. Esto consiste de dos niveles: resistencia 1.5621 - 0.0000
Los marcos de tiempo M5 y M15 pueden tener más puntos de entrada falsos.
Open chart in a new window


