


signal strength 1 of 5

The Bullish Flag pattern has been formed on NZDCHF at M5. The lower boundary of the pattern is located at 0.4839/0.4829, while the higher boundary lies at 0.4849/0.4839. The projection of the flagpole is 26 points. This formation signals that the upward trend is most likely to continue. Therefore, if the level of 0.4849 is broken, the price will move further upwards.
The M5 and M15 time frames may have more false entry points.
- All
- Double Top
- Flag
- Head and Shoulders
- Pennant
- Rectangle
- Triangle
- Triple top
- All
- #AAPL
- #AMZN
- #Bitcoin
- #EBAY
- #FB
- #GOOG
- #INTC
- #KO
- #MA
- #MCD
- #MSFT
- #NTDOY
- #PEP
- #TSLA
- #TWTR
- AUDCAD
- AUDCHF
- AUDJPY
- AUDUSD
- EURCAD
- EURCHF
- EURGBP
- EURJPY
- EURNZD
- EURRUB
- EURUSD
- GBPAUD
- GBPCHF
- GBPJPY
- GBPUSD
- GOLD
- NZDCAD
- NZDCHF
- NZDJPY
- NZDUSD
- SILVER
- USDCAD
- USDCHF
- USDJPY
- USDRUB
- All
- M5
- M15
- M30
- H1
- D1
- All
- Buy
- Sale
- All
- 1
- 2
- 3
- 4
- 5
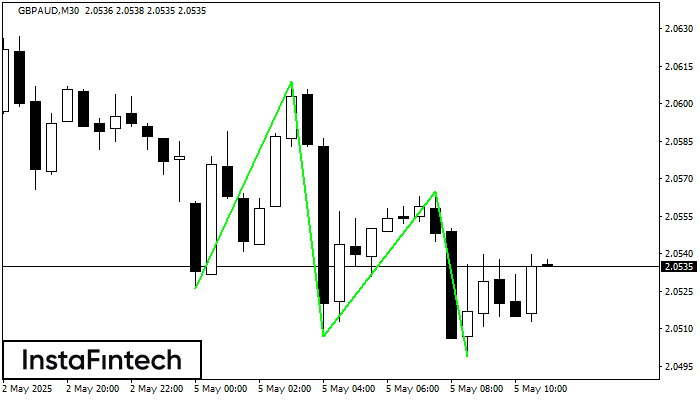
The Triple Bottom pattern has formed on the chart of GBPAUD M30. Features of the pattern: The lower line of the pattern has coordinates 2.0609 with the upper limit 2.0609/2.0565
Open chart in a new window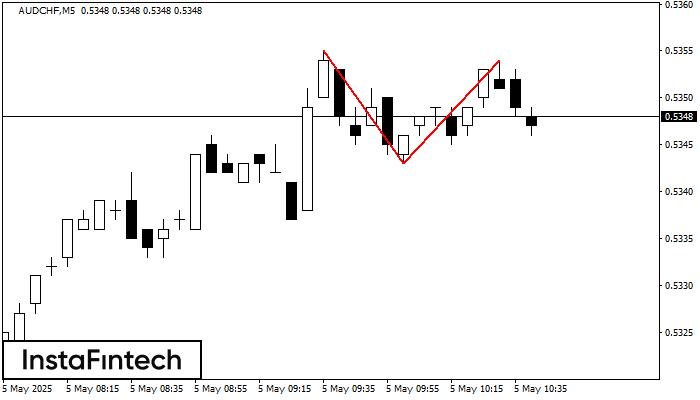
The Double Top reversal pattern has been formed on AUDCHF M5. Characteristics: the upper boundary 0.5355; the lower boundary 0.5343; the width of the pattern is 11 points. Sell trades
The M5 and M15 time frames may have more false entry points.
Open chart in a new window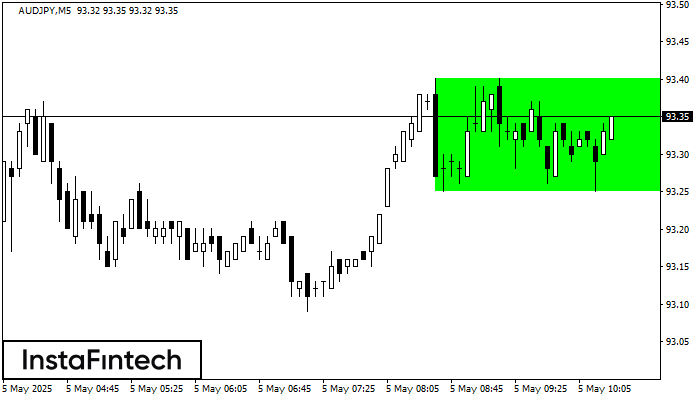
According to the chart of M5, AUDJPY formed the Bullish Rectangle. The pattern indicates a trend continuation. The upper border is 93.40, the lower border is 93.25. The signal means
The M5 and M15 time frames may have more false entry points.
Open chart in a new window


