empty
01.03.2024 09:50 AM
Technical Analysis of GBP/USD for March 1, 2024

GBP/USD Analysis: Navigating a Narrow Range Amidst Market Anticipation

Key Takeaways:

  1. The GBP/USD pair has breached a short-term supply zone, hinting at bullish momentum with a potential move toward the 1.2691 level.
  2. A mix of buy and sell signals from technical indicators and moving averages suggests a market in consolidation, awaiting a decisive breakout.
  3. Sentiment has shifted slightly towards bears in the last three days, despite a generally bullish stance over the past week.

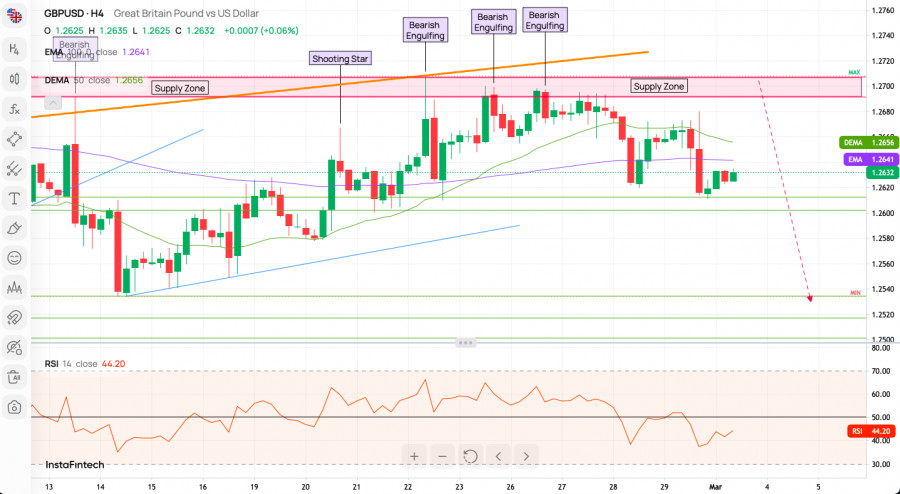
The GBP/USD pair has recently demonstrated a bullish inclination, successfully breaching the short-term supply zone. A sustained move above the 100-day moving average (MA) suggests potential for further upward momentum. However, the pair is currently consolidating gains, indicating a pivotal moment for traders as the market seeks direction.

This image is no longer relevant

Technical Highlights:
  • Uptrend Attempts: The pair's climb above the short-term supply zone (1.2613 - 1.2595) and subsequent local peak at 1.2628 indicates a positive outlook. The ascending momentum is intact, which could entice the bulls to propel the pair beyond the 100 MA (1.2625), targeting 1.2691.
  • Intraday Supports: Immediate technical support levels are established at 1.2612, 1.2603, and 1.2595. A dip below these floors may shift short-term sentiment to bearish, necessitating vigilance among bulls.
  • MA Confinement: The GBP/USD oscillation between the 50 MA (1.2620) and 100 MA (1.2579) underscores a horizontal trend, with market participants on the lookout for a decisive break. The crucial short-term support marks at 1.2517, a swing low from February 5th, 2024, remain vital to the pair's resilience.
Indicator Insights:
  • Mixed Indicator Signals: The technical indicators present a varied landscape, with 10 flashing 'Buy', 6 signaling 'Sell', and 6 remaining neutral. This divergence suggests a market in contemplation, weighing its next move.
  • Moving Average Trends: An overwhelming majority of moving averages (17 out of 18) suggest a 'Sell' signal, with only one contrarian 'Buy' signal. This could indicate underlying bearish pressure despite the recent bullish activity.

This image is no longer relevant

Sentiment Analysis:
  • Bullish Undertone: The sentiment scoreboard reflects a predominantly bullish stance, with a 55% majority over the bears' 45%. This bullish trend is consistent with last week's sentiment. However, a recent shift shows a three-day bearish turn (44% bulls vs. 56% bears), hinting at a potential change in trader sentiment.
Pivot Point Projections:
  • Resistance Levels: WR3 (1.27136), WR2 (1.26917), WR1 (1.26836)
  • Pivot Line: Weekly Pivot at 1.26698
  • Support Levels: WS1 (1.26617), WS2 (1.26479), WS3 (1.26260)

The GBP/USD pair currently hovers near a critical juncture, with bulls eager to cement their control. The recent bullish sentiment on the scoreboard and the technical breach above the supply zone provide a constructive backdrop. Nevertheless, the predominance of 'Sell' signals from moving averages and a shift to bearish sentiment in the last three days introduce caution. As the currency pair wrestles with moving average thresholds, the directional bias remains somewhat uncertain.

Useful Links

Important Notice

The begginers in forex trading need to be very careful when making decisions about entering the market. Before the release of important reports, it is best to stay out of the market to avoid being caught in sharp market fluctuations due to increased volatility. If you decide to trade during the news release, then always place stop orders to minimize losses.

Without placing stop orders, you can very quickly lose your entire deposit, especially if you do not use money management and trade large volumes. For successful trading, you need to have a clear trading plan and stay focues and disciplined. Spontaneous trading decision based on the current market situation is an inherently losing strategy for a scalper or daytrader.

#instaforex #analysis #sebastianseliga

ٹائم فریم منتخب کریں
5
منٹ
15
منٹ
30
منٹ
1
گھنٹہ
4
گھنٹے
1
دن
1
ہفتہ
انسٹافاریکس کے ساتھ کرپٹو کرنسی کی معاملاتی تبدیلیوں سے کمائیں۔
میٹا ٹریڈر 4 ڈاؤن لوڈ کریں اور اپنی پہلی ٹریڈ کھولیں۔
  • Grand Choice
    Contest by
    InstaForex
    InstaForex always strives to help you
    fulfill your biggest dreams.
    مقابلہ میں شامل ہوں

تجویز کردہ مضامین

یورو / یو ایس ڈی تجزیہ اور پیشن گوئی. مارکیٹ کی موجودہ صورتحال

تکنیکی نقطہ نظر سے، جیسا کہ بُلز نے 146.80 کی سطح کے ارد گرد 100 دن کی سادہ موونگ ایوریج (ایس ایم اے) کی رکاوٹ کو عبور کیا ہے،

Irina Yanina 19:42 2025-06-23 UTC+2

جون 23 2025 کو جی بی پی / یو ایس ڈی کی پیشن گوئی

گھنٹہ وار چارٹ پر، جمعہ کو جی بی پی / یو ایس ڈی پئیر 1.3425–1.3444 کے سپورٹ زون سے نیچے مضبوط ہو گیا، جس سے ایک بار پھر 1.3357–1.3373

Samir Klishi 14:24 2025-06-23 UTC+2

جون 19-22 2025 کے لیے یورو / یو ایس ڈی کے لیے تجارتی سگنل: 1.1535 سے نیچے فروخت کریں (21 ایس ایم اے - 8/8 مرے)

یورو کے لیے آؤٹ لک منفی رہتا ہے، کیونکہ تیل کی بڑھتی ہوئی قیمتیں یورپی کرنسی پر دباؤ ڈال سکتی ہیں۔ بدلے میں، ہم توقع کر سکتے ہیں کہ یورو

Dimitrios Zappas 19:40 2025-06-19 UTC+2

جون 19-22 2025 کے لیے سونے (ایکس اے یو / یو ایس ڈی) کے لیے تجارتی سگنل: $3,390 سے نیچے فروخت (21 ایس ایم اے - 8/8 مرے)

یہ کہ 3,390 سے اوپر کی واپسی سونے کے چکر کو بدل سکتی ہے، اور ہم توقع کر سکتے ہیں کہ یہ 3,437 اور یہاں تک کہ 3,500 کی نفسیاتی

Dimitrios Zappas 19:36 2025-06-19 UTC+2

چاندی : تجزیہ اور پیشن گوئی

اس وقت، چاندی فروری 2012 کے بعد اپنی بلند ترین سطح پر پہنچنے کے بعد مستحکم ہو رہی ہے، پچھلے سیشن میں نمایاں اضافہ کے بعد۔ یہ $37.00

Irina Yanina 19:25 2025-06-18 UTC+2

جون 18-22 2025 کے لیے سونے (ایکس اے یو / یو ایس ڈی) کے لیے تجارتی سگنل: $3,404 سے نیچے فروخت (21 ایس ایم اے - 8/8 مرے)

تکنیکی طور پر، سونا نیچے کی طرف دباؤ میں ہے۔ اس طرح، اگر قیمت 7/8 مرے کی سطح سے نیچے یا 3,360 سے نیچے آجائے تو ایک تیز سرعت

Dimitrios Zappas 15:21 2025-06-18 UTC+2

جون 18-22 2025 کے لیے یورو / یو ایس ڈی کے لیے تجارتی اشارہ : 1.1540 سے نیچے فروخت کریں (21 ایس ایم اے - 7/8 مرے)

تکنیکی طور پر، یورو / یو ایس ڈی پئیر آنے والے دنوں میں ایک مضبوط تکنیکی اصلاح (تصحیح) کا سامنا کر سکتی ہے اور ممکن ہے کہ یہ 1.1140

Dimitrios Zappas 14:53 2025-06-18 UTC+2

جی بی پی / یو ایس ڈی کی پیشن گوئی برائے 17 جون 2026

فی گھنٹہ چارٹ پر، پیر کو جی بی پی / یو ایس ڈی پئیر دوبارہ 1.3611–1.3633 کے ریزسٹنس زون پر چڑھ گیا، اس سے باز آ گیا، اور واپس امریکی

Samir Klishi 15:40 2025-06-17 UTC+2

یورو / یو ایس ڈی کی پیشن گوئی برائے 17 جون 2025

پیر کو، یورو / یو ایس ڈی جوڑے نے اپنی اوپر کی حرکت کو جاری رکھا، جو 1.1574 پر 100.0% اصلاحی سطح سے اوپر مستحکم ہوا، لیکن بعد میں اضافہ

Samir Klishi 15:15 2025-06-17 UTC+2

یورو / یو ایس ڈی کی پیشن گوئی برائے 16 جون 2025

جمعہ کو، یورو / یو ایس ڈی پئیر امریکی ڈالر کے حق میں پلٹ گیا اور 1.1574 پر 100.0% فیبوناچی اصلاحی سطح سے نیچے مستحکم ہو گیا۔ یہ بغیر

Samir Klishi 15:49 2025-06-16 UTC+2
ابھی فوری بات نہیں کرسکتے ؟
اپنا سوال پوچھیں بذریعہ چیٹ.
Widget callback
 

Dear visitor,

Your IP address shows that you are currently located in the USA. If you are a resident of the United States, you are prohibited from using the services of InstaFintech Group including online trading, online transfers, deposit/withdrawal of funds, etc.

If you think you are seeing this message by mistake and your location is not the US, kindly proceed to the website. Otherwise, you must leave the website in order to comply with government restrictions.

Why does your IP address show your location as the USA?

  • - you are using a VPN provided by a hosting company based in the United States;
  • - your IP does not have proper WHOIS records;
  • - an error occurred in the WHOIS geolocation database.

Please confirm whether you are a US resident or not by clicking the relevant button below. If you choose the wrong option, being a US resident, you will not be able to open an account with InstaForex anyway.

We are sorry for any inconvenience caused by this message.