empty
18.03.2025 11:03 AM
GBP/USD – March 18: Will the FOMC Help the Dollar?

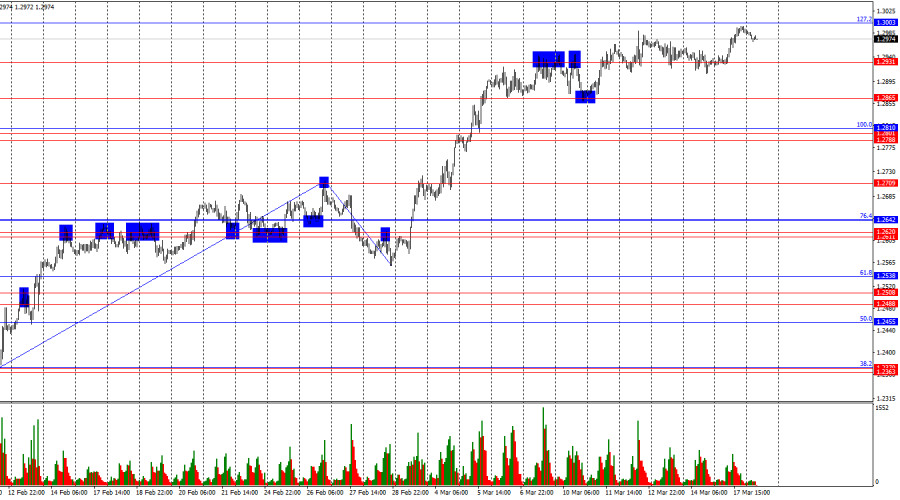
On the hourly chart, GBP/USD rebounded from the 1.2931 level on Monday and resumed its upward movement toward the 127.2% Fibonacci level at 1.3003. A rejection from this level would favor the U.S. dollar and lead to a slight decline toward 1.2931. A break and consolidation above 1.3003 would indicate continued growth toward the next level at 1.3151.

This image is no longer relevant

The wave pattern is absolutely clear. The last completed downward wave did not break the previous low, while the last upward wave surpassed the previous peak. This confirms that the bullish trend is still forming. The British pound has recently shown very strong growth, perhaps even excessive. The fundamental backdrop is not strong enough to justify such aggressive bullish action. However, most traders refuse to buy the dollar regardless of economic data because Donald Trump continuously imposes new tariffs, which will eventually harm U.S. economic growth and that of many other countries.

Monday's fundamental backdrop was weak, but bullish traders took advantage of one of the few opportunities available—a weak U.S. retail sales report. However, the market is now shifting its focus to more important events this week, namely the FOMC meeting on Wednesday and the Bank of England meeting on Thursday. Judging by the continued decline of the U.S. dollar, bears are not expecting any positive news.

Traders expect the FOMC to soften its monetary policy rhetoric, given expectations of an economic slowdown in the coming quarters. However, I do not believe the Fed will aggressively ease policy, as U.S. inflation remains elevated. As for the Bank of England, interest rates are expected to remain unchanged, and the UK economy is not showing clear signs of acceleration or slowdown. Trump has not imposed tariffs on the UK, and there is no fundamental reason for the British economy to grow significantly.

This image is no longer relevant

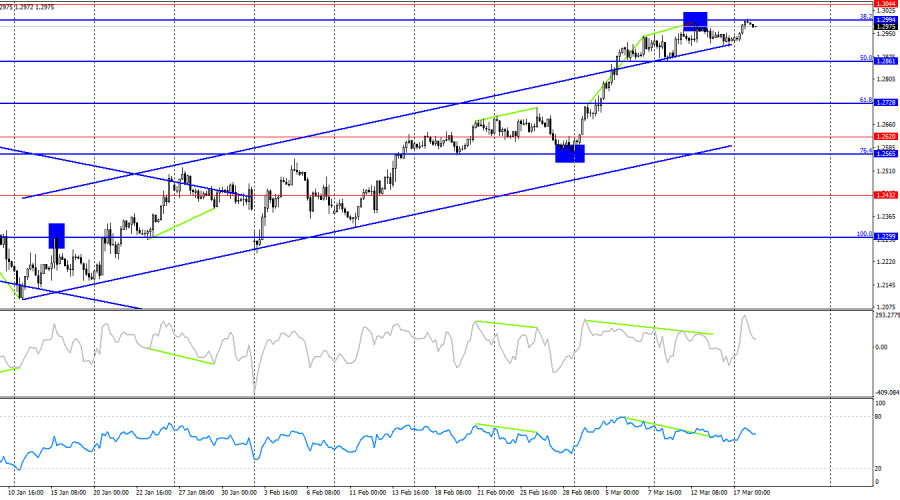
On the 4-hour chart, the bullish trend continues. I do not expect a significant decline in GBP/USD unless the pair closes below the rising channel. The CCI indicator has formed a bearish divergence, but so far, it has had no impact on bulls' positions. A rejection from 1.2994 could lead to a moderate pullback toward the 50.0% Fibonacci level at 1.2861, but bears are absent from the market.

Commitments of Traders (COT) Report

This image is no longer relevant

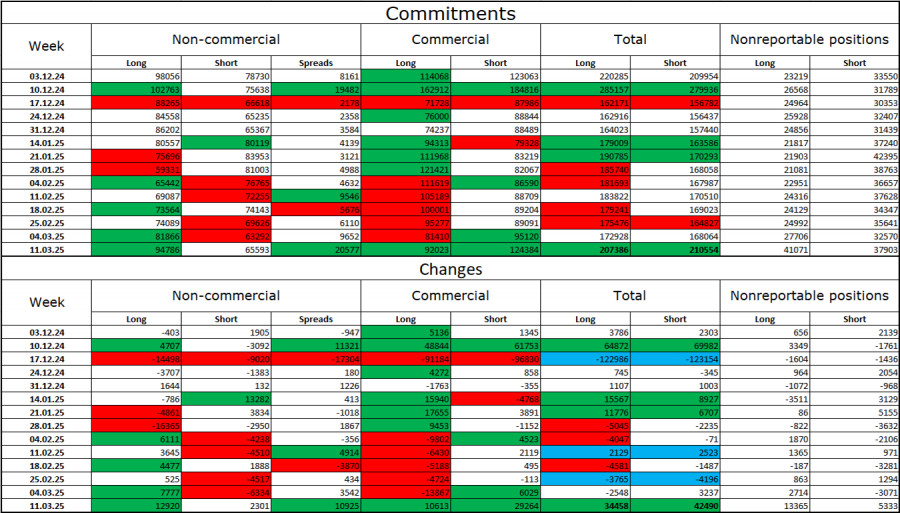
The Non-commercial category of traders became even more bullish last week. The number of long positions held by speculators increased by 12,920, while short positions increased by only 2,301. Bears have lost their market advantage, with the gap between long and short positions now nearly 30,000 in favor of bulls (95,000 vs. 66,000).

In my opinion, the British pound still has room for a decline, but recent events could force the market into a long-term shift. Over the past three months, the number of long positions decreased from 98,000 to 94,000, while short positions dropped from 78,000 to 66,000. However, the more significant trend is that in the last six weeks, long positions have surged from 59,000 to 95,000, while short positions have fallen from 81,000 to 66,000. Let's not forget—this has been "six weeks under Trump."

Economic Calendar for the U.S. and the UK

  • U.S. – Building Permits (12:30 UTC)
  • U.S. – Housing Starts (12:30 UTC)
  • U.S. – Industrial Production Change (12:30 UTC)

On Tuesday, the economic calendar includes three events, but all of them are second-tier data. The overall market impact is expected to be weak.

GBP/USD Forecast and Trading Recommendations

Short positions were possible on a rejection from 1.2994 on the 4-hour chart, targeting 1.2931 and 1.2865. These trades can remain open, but bearish activity in the market is minimal. Long positions are viable on a rebound from 1.2931 on the hourly chart or after a breakout above 1.3003, with a target at 1.3151.

Fibonacci retracement grids are drawn from 1.2809 to 1.2100 on the hourly chart and from 1.2299 to 1.3432 on the 4-hour chart.

Samir Klishi,
انسٹافاریکس کا تجزیاتی ماہر
© 2007-2025
ٹائم فریم منتخب کریں
5
منٹ
15
منٹ
30
منٹ
1
گھنٹہ
4
گھنٹے
1
دن
1
ہفتہ
انسٹافاریکس کے ساتھ کرپٹو کرنسی کی معاملاتی تبدیلیوں سے کمائیں۔
میٹا ٹریڈر 4 ڈاؤن لوڈ کریں اور اپنی پہلی ٹریڈ کھولیں۔
  • Grand Choice
    Contest by
    InstaForex
    InstaForex always strives to help you
    fulfill your biggest dreams.
    مقابلہ میں شامل ہوں

تجویز کردہ مضامین

سونا: تجزیہ اور پیشن گوئی - مارکیٹ میں جاری صورتحال

تکنیکی نقطہ نظر سے، 4 گھنٹے کے چارٹ پر سونے نے 100 مدت کے سادہ موونگ ایوریج (ایس ایم اے) سے نیچے قبولیت قائم کی ہے، جو کمی کے ممکنہ

Irina Yanina 20:22 2025-06-24 UTC+2

یورو / یو ایس ڈی تجزیہ اور پیشن گوئی. مارکیٹ کی موجودہ صورتحال

تکنیکی نقطہ نظر سے، جیسا کہ بُلز نے 146.80 کی سطح کے ارد گرد 100 دن کی سادہ موونگ ایوریج (ایس ایم اے) کی رکاوٹ کو عبور کیا ہے،

Irina Yanina 19:42 2025-06-23 UTC+2

جون 23 2025 کو جی بی پی / یو ایس ڈی کی پیشن گوئی

گھنٹہ وار چارٹ پر، جمعہ کو جی بی پی / یو ایس ڈی پئیر 1.3425–1.3444 کے سپورٹ زون سے نیچے مضبوط ہو گیا، جس سے ایک بار پھر 1.3357–1.3373

Samir Klishi 14:24 2025-06-23 UTC+2

جون 19-22 2025 کے لیے یورو / یو ایس ڈی کے لیے تجارتی سگنل: 1.1535 سے نیچے فروخت کریں (21 ایس ایم اے - 8/8 مرے)

یورو کے لیے آؤٹ لک منفی رہتا ہے، کیونکہ تیل کی بڑھتی ہوئی قیمتیں یورپی کرنسی پر دباؤ ڈال سکتی ہیں۔ بدلے میں، ہم توقع کر سکتے ہیں کہ یورو

Dimitrios Zappas 19:40 2025-06-19 UTC+2

جون 19-22 2025 کے لیے سونے (ایکس اے یو / یو ایس ڈی) کے لیے تجارتی سگنل: $3,390 سے نیچے فروخت (21 ایس ایم اے - 8/8 مرے)

یہ کہ 3,390 سے اوپر کی واپسی سونے کے چکر کو بدل سکتی ہے، اور ہم توقع کر سکتے ہیں کہ یہ 3,437 اور یہاں تک کہ 3,500 کی نفسیاتی

Dimitrios Zappas 19:36 2025-06-19 UTC+2

چاندی : تجزیہ اور پیشن گوئی

اس وقت، چاندی فروری 2012 کے بعد اپنی بلند ترین سطح پر پہنچنے کے بعد مستحکم ہو رہی ہے، پچھلے سیشن میں نمایاں اضافہ کے بعد۔ یہ $37.00

Irina Yanina 19:25 2025-06-18 UTC+2

جون 18-22 2025 کے لیے سونے (ایکس اے یو / یو ایس ڈی) کے لیے تجارتی سگنل: $3,404 سے نیچے فروخت (21 ایس ایم اے - 8/8 مرے)

تکنیکی طور پر، سونا نیچے کی طرف دباؤ میں ہے۔ اس طرح، اگر قیمت 7/8 مرے کی سطح سے نیچے یا 3,360 سے نیچے آجائے تو ایک تیز سرعت

Dimitrios Zappas 15:21 2025-06-18 UTC+2

جون 18-22 2025 کے لیے یورو / یو ایس ڈی کے لیے تجارتی اشارہ : 1.1540 سے نیچے فروخت کریں (21 ایس ایم اے - 7/8 مرے)

تکنیکی طور پر، یورو / یو ایس ڈی پئیر آنے والے دنوں میں ایک مضبوط تکنیکی اصلاح (تصحیح) کا سامنا کر سکتی ہے اور ممکن ہے کہ یہ 1.1140

Dimitrios Zappas 14:53 2025-06-18 UTC+2

جی بی پی / یو ایس ڈی کی پیشن گوئی برائے 17 جون 2026

فی گھنٹہ چارٹ پر، پیر کو جی بی پی / یو ایس ڈی پئیر دوبارہ 1.3611–1.3633 کے ریزسٹنس زون پر چڑھ گیا، اس سے باز آ گیا، اور واپس امریکی

Samir Klishi 15:40 2025-06-17 UTC+2

یورو / یو ایس ڈی کی پیشن گوئی برائے 17 جون 2025

پیر کو، یورو / یو ایس ڈی جوڑے نے اپنی اوپر کی حرکت کو جاری رکھا، جو 1.1574 پر 100.0% اصلاحی سطح سے اوپر مستحکم ہوا، لیکن بعد میں اضافہ

Samir Klishi 15:15 2025-06-17 UTC+2
ابھی فوری بات نہیں کرسکتے ؟
اپنا سوال پوچھیں بذریعہ چیٹ.
Widget callback
 

Dear visitor,

Your IP address shows that you are currently located in the USA. If you are a resident of the United States, you are prohibited from using the services of InstaFintech Group including online trading, online transfers, deposit/withdrawal of funds, etc.

If you think you are seeing this message by mistake and your location is not the US, kindly proceed to the website. Otherwise, you must leave the website in order to comply with government restrictions.

Why does your IP address show your location as the USA?

  • - you are using a VPN provided by a hosting company based in the United States;
  • - your IP does not have proper WHOIS records;
  • - an error occurred in the WHOIS geolocation database.

Please confirm whether you are a US resident or not by clicking the relevant button below. If you choose the wrong option, being a US resident, you will not be able to open an account with InstaForex anyway.

We are sorry for any inconvenience caused by this message.