empty
27.03.2025 11:37 AM
EUR/USD – March 27th: The Dollar Gradually Strengthens

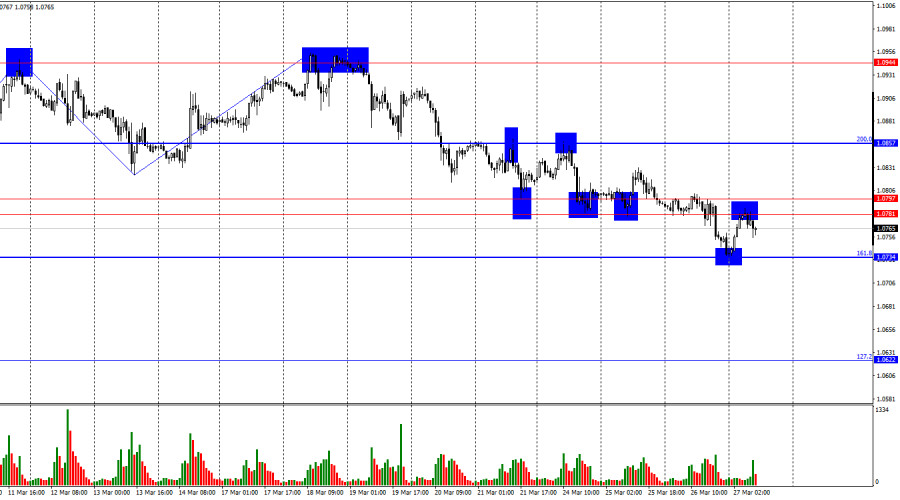
On Wednesday, the EUR/USD pair continued to decline, stopping only near the 161.8% Fibonacci retracement level at 1.0734. A rebound from this level allowed the pair to recover to the support zone of 1.0781–1.0797, but another rebound from this area opens the door for a renewed decline with a potential close below 1.0734. Conversely, a consolidation above the 1.0781–1.0797 zone would suggest the possibility of further euro growth toward the 200.0% retracement level at 1.0857.

This image is no longer relevant

The wave situation on the hourly chart has evolved. The last completed upward wave barely broke the previous peak, while the most recent downward wave broke the previous low. This indicates a gradual trend reversal toward a bearish direction. For several weeks, Donald Trump's tariffs exerted strong pressure on the dollar, but the market has now shown only a weak reaction to the latest round of tariffs.

Wednesday's news backdrop was both interesting and important. The U.S. durable goods orders report showed a 0.9% increase, beating the -1% forecast. Orders excluding transportation rose 0.7% (vs. 0.2% expected), and orders excluding defense climbed 0.8% (vs. -1.6% expected). These three key reports provided strong support for the bears. It was also announced yesterday that Trump imposed a 25% tariff on all automobiles imported into the U.S. Whereas previously such news would have triggered a sharp sell-off in the dollar, the reaction this time was minimal. This suggests the market may be growing desensitized to this factor. Of course, further tariffs are expected to be announced in early April, and their severity could again weigh on the dollar. But for now, this topic may be considered priced in.

This image is no longer relevant

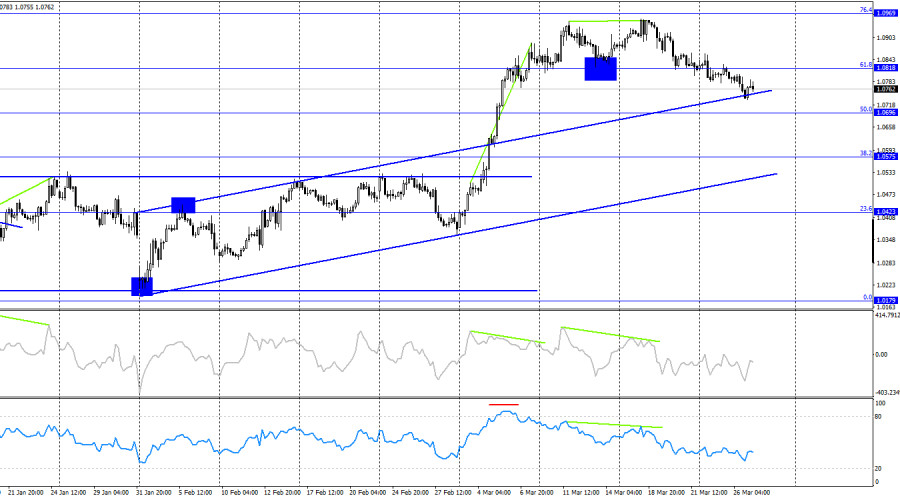
On the 4-hour chart, the pair reversed in favor of the U.S. dollar after forming another bearish divergence and consolidating below the 61.8% Fibonacci level at 1.0818. Therefore, further decline toward the 50.0% level at 1.0696 remains possible. There's still room for downside, as the price is trading above the ascending trend channel. No fresh divergences are currently forming on any indicators.

Commitments of Traders (COT) Report:

This image is no longer relevant

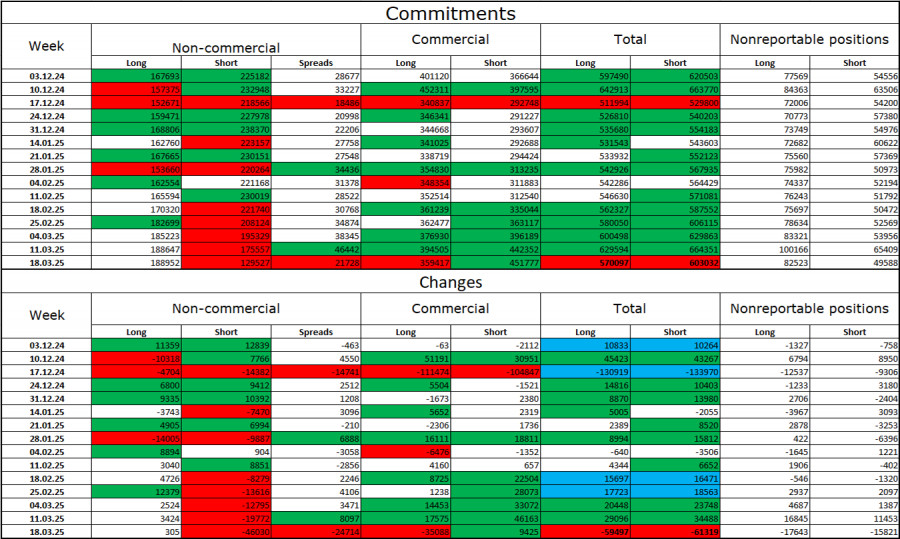
During the latest reporting week, professional traders opened 305 new long positions and closed 46,030 short ones. The sentiment among the "Non-commercial" group turned bullish again—thanks to Donald Trump. The total number of long positions held by speculators now stands at 189,000, compared to 129,000 short positions.

For 20 weeks, large players had been offloading the euro, but for the past 6 weeks, they have been shedding shorts and building up longs. The divergence in monetary policy approaches between the ECB and the Fed still favors the U.S. dollar due to widening interest rate differentials, but Trump's trade policy is a more influential factor for traders, potentially pressuring the Fed toward a more dovish stance and even triggering a U.S. recession.

Economic Calendar for the U.S. and the Eurozone:

  • U.S. – Final Q4 GDP (12:30 UTC)
  • U.S. – Initial Jobless Claims (12:30 UTC)
  • Eurozone – ECB President Christine Lagarde Speech (18:05 UTC)

The March 27 economic calendar includes three key events, two of which are quite significant. News flow may have a notable impact on market sentiment in the second half of the day.

EUR/USD Forecast and Trader Tips:

Selling opportunities were available after the pair closed below the 1.0781–1.0797 zone, targeting 1.0734 and 1.0622. The first target has been reached. Today, selling from a rebound from the 1.0781–1.0797 zone remains a valid strategy with the same targets. Buying can be considered only if the pair closes above this zone on the hourly chart, aiming for 1.0857—but bears are currently in control.

Fibonacci levels are plotted from 1.0529 to 1.0213 on the hourly chart and from 1.1214 to 1.0179 on the 4-hour chart.

Samir Klishi,
انسٹافاریکس کا تجزیاتی ماہر
© 2007-2025
ٹائم فریم منتخب کریں
5
منٹ
15
منٹ
30
منٹ
1
گھنٹہ
4
گھنٹے
1
دن
1
ہفتہ
انسٹافاریکس کے ساتھ کرپٹو کرنسی کی معاملاتی تبدیلیوں سے کمائیں۔
میٹا ٹریڈر 4 ڈاؤن لوڈ کریں اور اپنی پہلی ٹریڈ کھولیں۔
  • Grand Choice
    Contest by
    InstaForex
    InstaForex always strives to help you
    fulfill your biggest dreams.
    مقابلہ میں شامل ہوں

تجویز کردہ مضامین

جی بی پی / یو ایس ڈی کی پیشن گوئی برائے 16 مئی

گھنٹہ وار چارٹ پر، جمعرات کو جی بی پی / یو ایس ڈی جوڑی ایک بار پھر برطانوی پاؤنڈ کے حق میں پلٹ گئی اور 1.3344–1.3357 کے مزاحمتی

Samir Klishi 15:54 2025-05-16 UTC+2

امریکی ڈالر اندیکس {ڈی ایکس وائے} تجزیہ اور پیشن گوئی

امریکی ڈالر انڈیکس، جو بڑی کرنسیوں کی ٹوکری کے مقابلے میں امریکی ڈالر کی کارکردگی کو ٹریک کرتا ہے، مسلسل دوسرے دن بھی مندی کے تعصب کے ساتھ تجارت جاری

Irina Yanina 15:50 2025-05-16 UTC+2

یو ایس ڈی / سی اے ڈی : تجزیہ اور پیشن گوئی

جمعہ تک، یو ایس ڈی / سی اے ڈی پئیر مسلسل دوسرے دن دباؤ میں ہے، جو منفی عوامل کے امتزاج سے کارفرما ہے۔ کل کے متوقع سے کمزور امریکی

Irina Yanina 15:42 2025-05-16 UTC+2

یورو / یو ایس ڈی کی پیشن گوئی برائے 15 مئی 2025

بدھ کے روز، یورو / یو ایس ڈی پئیر 1.1265–1.1282 کے مزاحمتی زون کی طرف بڑھ گیا، اس سے باز آ گیا، اور امریکی ڈالر کے حق میں پلٹ گیا،

Samir Klishi 17:19 2025-05-15 UTC+2

مئی 15-19 2025 کے لیے سونے کے لیے تجارتی سگنل: $3,222 سے اوپر خریدیں یا $3,203 سے نیچے فروخت کریں (200 ای ایم اے - 5/8 مرے)

یہ کہ 3,203 سے اوپر کا فیصلہ کن بریک تنزلی کے رجحان کے خاتمے کا اشارہ دے سکتا ہے اور سونے کے لیے تیزی کے نئے دور کا آغاز

Dimitrios Zappas 17:14 2025-05-15 UTC+2

مئی 15-19 2025 کے لیے بٹ کوائن کے لیے تجارتی سگنل: $103,600 سے نیچے فروخت کریں (+1/8 مرے - 21 ایس ایم اے)

اگر بٹ کوائن 103,700 سے اوپر ٹوٹنے میں ناکام رہتا ہے، تو مزید تکنیکی اصلاح کی توقع کی جاتی ہے۔ لہٰذا، قیمت $100,000 کی نفسیاتی سطح تک پہنچ سکتی

Dimitrios Zappas 17:11 2025-05-15 UTC+2

مئی 15 2025 کو جی بی پی / یو ایس ڈی کی پیشن گوئی

فی گھنٹہ چارٹ پر، جی ڈی پی جوڑا بدھ کے روز 1.3344–1.3357 کے مزاحمتی زون پر چڑھ گیا، اس سے ریباؤنڈ ہوا، اور 1.3205 پر 100.0% فیبوناچی

Samir Klishi 16:56 2025-05-15 UTC+2

ڈبلیو ٹی آئی - ویسٹ ٹیکساس انٹرمیڈیٹ۔ تجزیہ اور پیشن گوئی

یو ایس کروڈ آئل ویسٹ ٹیکساس انٹرمیڈیٹ (ڈبلیو ٹی آئی) کی قیمتیں ایک ماہ کی بلند ترین سطح کے قریب مستحکم ہو رہی ہیں،

Irina Yanina 19:05 2025-05-14 UTC+2

مئی 13 2025 کو یورو / یو ایس ڈی کی پیشن گوئی

پیر کے روز، یورو / یو ایس ڈی پئیر نے جمعہ کو 1.1265–1.1282 کے مزاحمتی زون سے ری باؤنڈنگ کے بعد اپنی کمی کو جاری رکھا۔ جوڑا 1.1181 پر 127.2%

Samir Klishi 14:15 2025-05-13 UTC+2

13 مئی 2025 کے لیے یورو/امریکی ڈالر کی پیش گوئی

کل کی مرکزی تقریب، جس نے بازاروں کو کسی حد تک الجھا دیا، امریکہ اور چین کے درمیان باہمی محصولات پر واپس جانے کا معاہدہ تھا جو 2 اپریل

Laurie Bailey 13:39 2025-05-13 UTC+2
ابھی فوری بات نہیں کرسکتے ؟
اپنا سوال پوچھیں بذریعہ چیٹ.
Widget callback
 

Dear visitor,

Your IP address shows that you are currently located in the USA. If you are a resident of the United States, you are prohibited from using the services of InstaFintech Group including online trading, online transfers, deposit/withdrawal of funds, etc.

If you think you are seeing this message by mistake and your location is not the US, kindly proceed to the website. Otherwise, you must leave the website in order to comply with government restrictions.

Why does your IP address show your location as the USA?

  • - you are using a VPN provided by a hosting company based in the United States;
  • - your IP does not have proper WHOIS records;
  • - an error occurred in the WHOIS geolocation database.

Please confirm whether you are a US resident or not by clicking the relevant button below. If you choose the wrong option, being a US resident, you will not be able to open an account with InstaForex anyway.

We are sorry for any inconvenience caused by this message.