

signal strength 1 of 5

According to the chart of M5, AUDUSD formed the Bullish Symmetrical Triangle pattern, which signals the trend will continue. Description. The upper border of the pattern touches the coordinates 0.6295/0.6288 whereas the lower border goes across 0.6279/0.6288. The pattern width is measured on the chart at 16 pips. If the Bullish Symmetrical Triangle pattern is in progress during the upward trend, this indicates the current trend will go on. In case 0.6288 is broken, the price could continue its move toward 0.6303.
The M5 and M15 time frames may have more false entry points.
- All
- Double Top
- Flag
- Head and Shoulders
- Pennant
- Rectangle
- Triangle
- Triple top
- All
- #AAPL
- #AMZN
- #Bitcoin
- #EBAY
- #FB
- #GOOG
- #INTC
- #KO
- #MA
- #MCD
- #MSFT
- #NTDOY
- #PEP
- #TSLA
- #TWTR
- AUDCAD
- AUDCHF
- AUDJPY
- AUDUSD
- EURCAD
- EURCHF
- EURGBP
- EURJPY
- EURNZD
- EURRUB
- EURUSD
- GBPAUD
- GBPCHF
- GBPJPY
- GBPUSD
- GOLD
- NZDCAD
- NZDCHF
- NZDJPY
- NZDUSD
- SILVER
- USDCAD
- USDCHF
- USDJPY
- USDRUB
- All
- M5
- M15
- M30
- H1
- D1
- All
- Buy
- Sale
- All
- 1
- 2
- 3
- 4
- 5
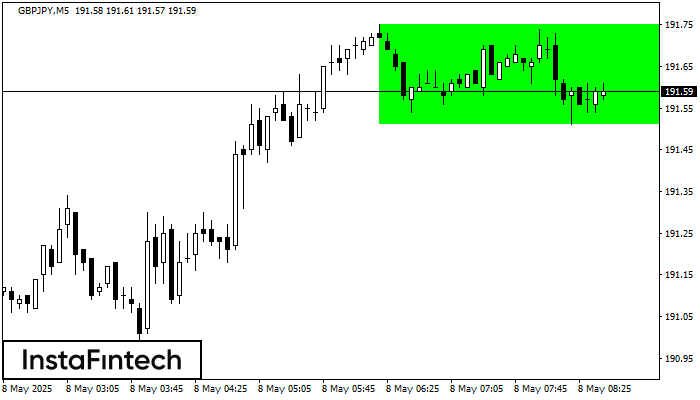
Сформирована фигура «Прямоугольник» на графике GBPJPY M5. Тип фигуры: Продолжение тренда; Границы: Верхняя 191.75, Нижняя 191.51; Сигнал: позицию на покупку следует открывать выше верхней границы прямоугольника 191.75
Таймфреймы М5 и М15 могут иметь больше ложных точек входа.
Открыть график инструмента в новом окне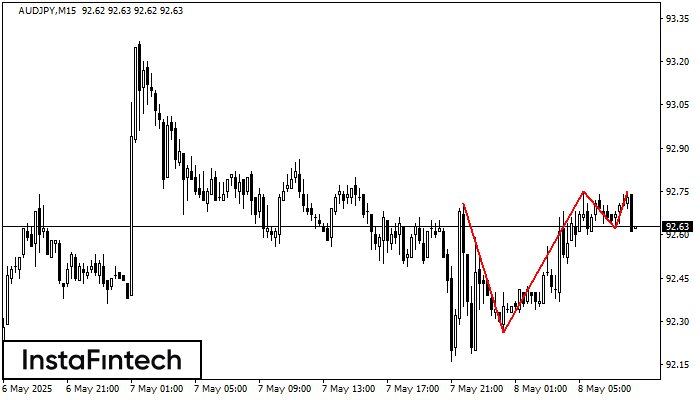
По AUDJPY на M15 сформировалась фигура «Тройная вершина». Характеристика: Границы имеют восходящий угол. Нижняя граница фигуры имеет координаты 92.26/92.62, при этом верхняя граница 92.71/92.75. Проекция ширины 45 пунктов. Формирование фигуры
Таймфреймы М5 и М15 могут иметь больше ложных точек входа.
Открыть график инструмента в новом окне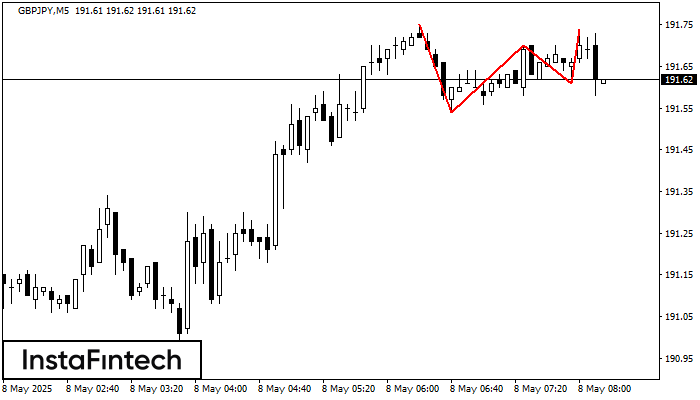
На графике GBPJPY M5 образовалась фигура «Тройная вершина». Данная фигура относится к типу разворотных и имеет характеристику: Верхняя граница 191.75/191.74; Нижняя граница 191.54/191.61; Ширина фигуры 9 пунктов. Прогноз: В случае
Таймфреймы М5 и М15 могут иметь больше ложных точек входа.
Открыть график инструмента в новом окне


