


signal strength 1 of 5

The Triple Bottom pattern has formed on the chart of USDJPY M5. Features of the pattern: The lower line of the pattern has coordinates 150.29 with the upper limit 150.29/150.27, the projection of the width is 19 points. The formation of the Triple Bottom pattern most likely indicates a change in the trend from downward to upward. This means that in the event of a breakdown of the resistance level 150.10, the price is most likely to continue the upward movement.
The M5 and M15 time frames may have more false entry points.
یہ بھی دیکھیں
- All
- Double Top
- Flag
- Head and Shoulders
- Pennant
- Rectangle
- Triangle
- Triple top
- All
- #AAPL
- #AMZN
- #Bitcoin
- #EBAY
- #FB
- #GOOG
- #INTC
- #KO
- #MA
- #MCD
- #MSFT
- #NTDOY
- #PEP
- #TSLA
- #TWTR
- AUDCAD
- AUDCHF
- AUDJPY
- AUDUSD
- EURCAD
- EURCHF
- EURGBP
- EURJPY
- EURNZD
- EURRUB
- EURUSD
- GBPAUD
- GBPCHF
- GBPJPY
- GBPUSD
- GOLD
- NZDCAD
- NZDCHF
- NZDJPY
- NZDUSD
- SILVER
- USDCAD
- USDCHF
- USDJPY
- USDRUB
- All
- M5
- M15
- M30
- H1
- D1
- All
- Buy
- Sale
- All
- 1
- 2
- 3
- 4
- 5
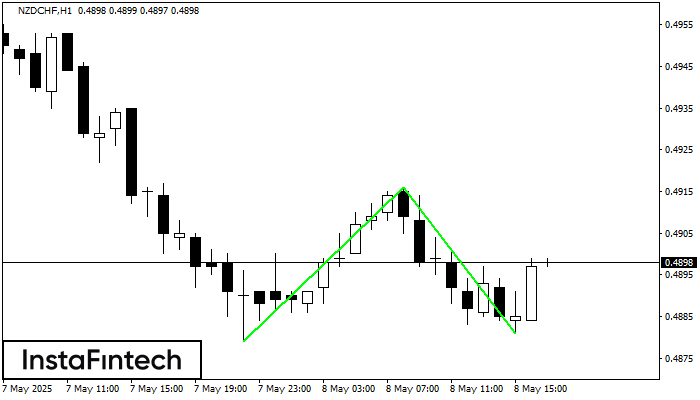
Сформирована фигура «Двойное дно» на графике NZDCHF H1. Характеристика: Уровень поддержки 0.4879; Уровень сопротивления 0.4916; Ширина фигуры 37 пунктов. В случае пробоя уровня сопротивления можно будет прогнозировать изменение тенденции
Открыть график инструмента в новом окне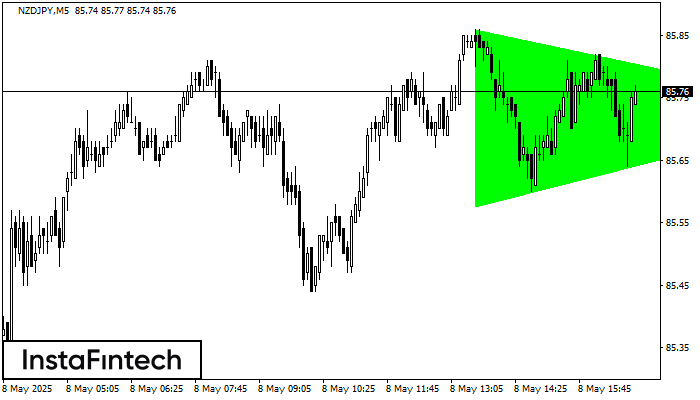
По NZDJPY на M5 сформировалась фигура «Бычий симметричный треугольник». Нижняя граница фигуры имеет координаты 85.58/85.73, при этом верхняя граница 85.86/85.73. Формирование фигуры «Бычий симметричный треугольник» наиболее вероятным образом свидетельствует
Таймфреймы М5 и М15 могут иметь больше ложных точек входа.
Открыть график инструмента в новом окне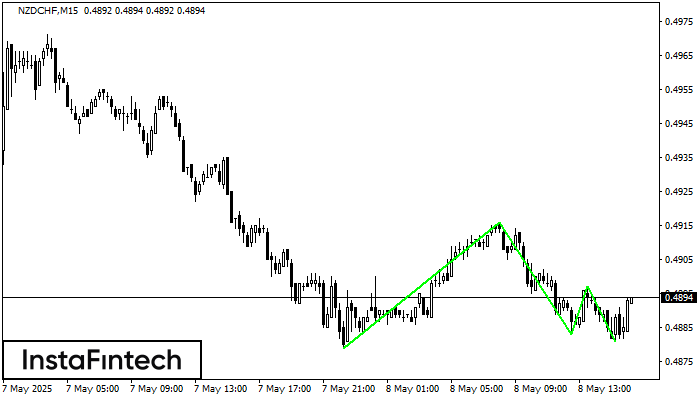
Сформирована фигура «Тройное дно» по торговому инструменту NZDCHF на M15. Фигура сигнализирует об изменении тенденции с нисходящей на восходящую в случае пробоя верхней границы 0.4897
Таймфреймы М5 и М15 могут иметь больше ложных точек входа.
Открыть график инструмента в новом окне


