


signal strength 2 of 5

According to the chart of M15, #Bitcoin produced the pattern termed the Inverse Head and Shoulder. The Head is fixed at 81609.29 while the median line of the Neck is set at 82839.07/82640.15. The formation of the Inverse Head and Shoulder Pattern clearly indicates a reversal of the downward trend. In means that in case the scenario comes true, the price of #Bitcoin will go towards 82640.38.
The M5 and M15 time frames may have more false entry points.
- All
- Double Top
- Flag
- Head and Shoulders
- Pennant
- Rectangle
- Triangle
- Triple top
- All
- #AAPL
- #AMZN
- #Bitcoin
- #EBAY
- #FB
- #GOOG
- #INTC
- #KO
- #MA
- #MCD
- #MSFT
- #NTDOY
- #PEP
- #TSLA
- #TWTR
- AUDCAD
- AUDCHF
- AUDJPY
- AUDUSD
- EURCAD
- EURCHF
- EURGBP
- EURJPY
- EURNZD
- EURRUB
- EURUSD
- GBPAUD
- GBPCHF
- GBPJPY
- GBPUSD
- GOLD
- NZDCAD
- NZDCHF
- NZDJPY
- NZDUSD
- SILVER
- USDCAD
- USDCHF
- USDJPY
- USDRUB
- All
- M5
- M15
- M30
- H1
- D1
- All
- Buy
- Sale
- All
- 1
- 2
- 3
- 4
- 5
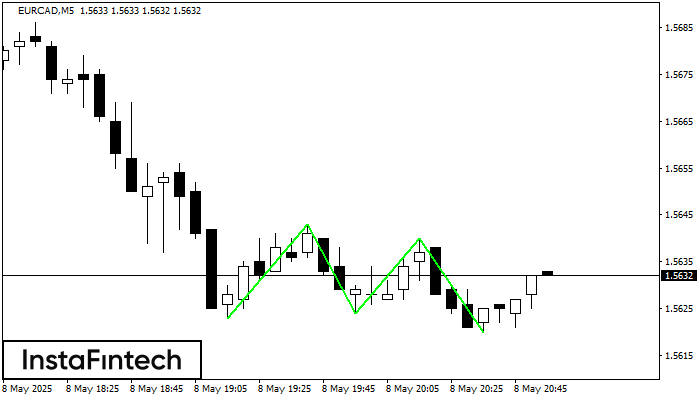
The Triple Bottom pattern has formed on the chart of the EURCAD M5 trading instrument. The pattern signals a change in the trend from downwards to upwards in the case
The M5 and M15 time frames may have more false entry points.
Open chart in a new window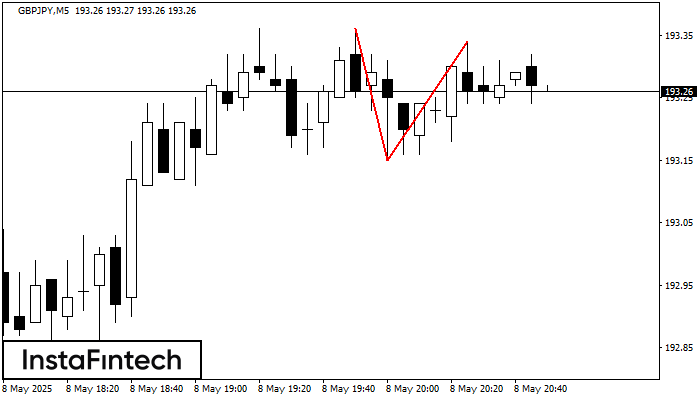
The Double Top reversal pattern has been formed on GBPJPY M5. Characteristics: the upper boundary 193.36; the lower boundary 193.15; the width of the pattern is 19 points. Sell trades
The M5 and M15 time frames may have more false entry points.
Open chart in a new window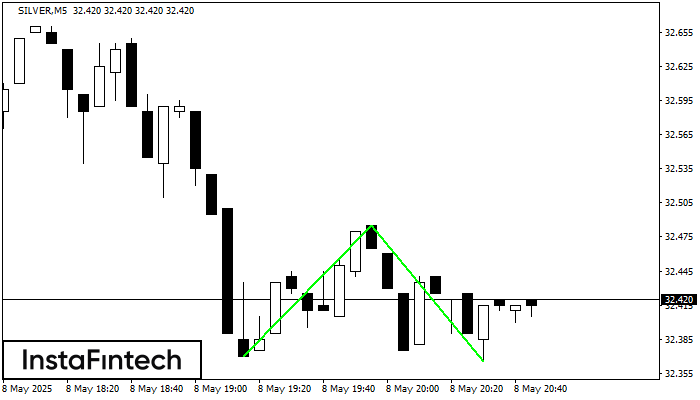
The Double Bottom pattern has been formed on SILVER M5; the upper boundary is 32.48; the lower boundary is 32.37. The width of the pattern is 115 points. In case
The M5 and M15 time frames may have more false entry points.
Open chart in a new window


