

signal strength 2 of 5
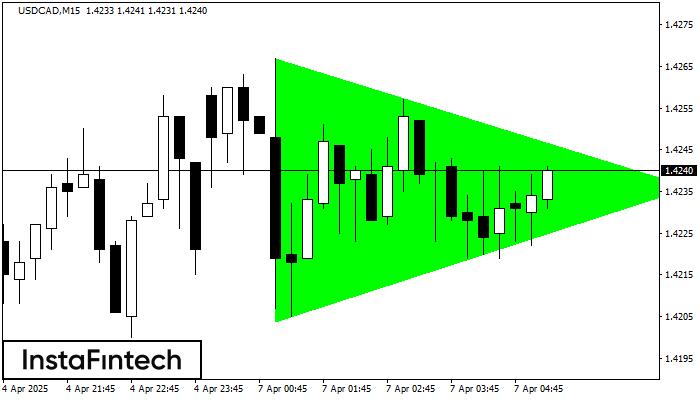
According to the chart of M15, USDCAD formed the Bullish Symmetrical Triangle pattern. Description: This is the pattern of a trend continuation. 1.4267 and 1.4204 are the coordinates of the upper and lower borders respectively. The pattern width is measured on the chart at 63 pips. Outlook: If the upper border 1.4267 is broken, the price is likely to continue its move by 1.4259.
The M5 and M15 time frames may have more false entry points.
یہ بھی دیکھیں
- All
- Double Top
- Flag
- Head and Shoulders
- Pennant
- Rectangle
- Triangle
- Triple top
- All
- #AAPL
- #AMZN
- #Bitcoin
- #EBAY
- #FB
- #GOOG
- #INTC
- #KO
- #MA
- #MCD
- #MSFT
- #NTDOY
- #PEP
- #TSLA
- #TWTR
- AUDCAD
- AUDCHF
- AUDJPY
- AUDUSD
- EURCAD
- EURCHF
- EURGBP
- EURJPY
- EURNZD
- EURRUB
- EURUSD
- GBPAUD
- GBPCHF
- GBPJPY
- GBPUSD
- GOLD
- NZDCAD
- NZDCHF
- NZDJPY
- NZDUSD
- SILVER
- USDCAD
- USDCHF
- USDJPY
- USDRUB
- All
- M5
- M15
- M30
- H1
- D1
- All
- Buy
- Sale
- All
- 1
- 2
- 3
- 4
- 5
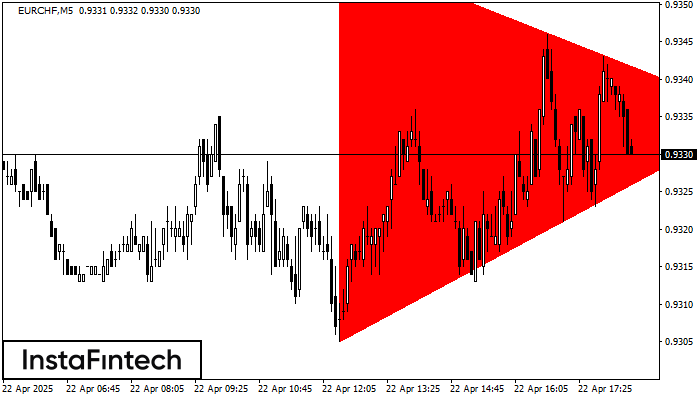
According to the chart of M5, EURCHF formed the Bearish Symmetrical Triangle pattern. Trading recommendations: A breach of the lower border 0.9305 is likely to encourage a continuation
The M5 and M15 time frames may have more false entry points.
Open chart in a new window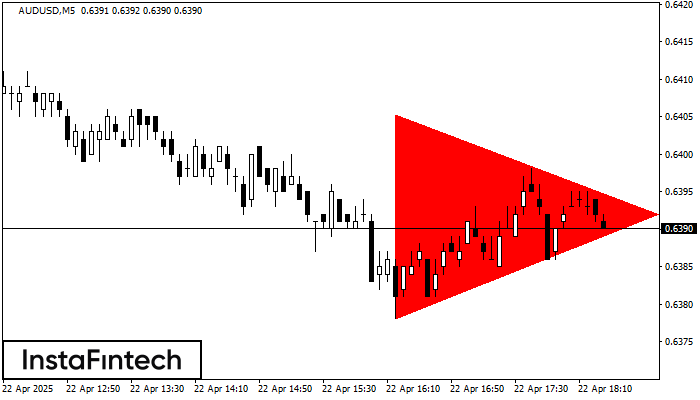
According to the chart of M5, AUDUSD formed the Bearish Symmetrical Triangle pattern. Description: The lower border is 0.6378/0.6392 and upper border is 0.6405/0.6392. The pattern width is measured
The M5 and M15 time frames may have more false entry points.
Open chart in a new window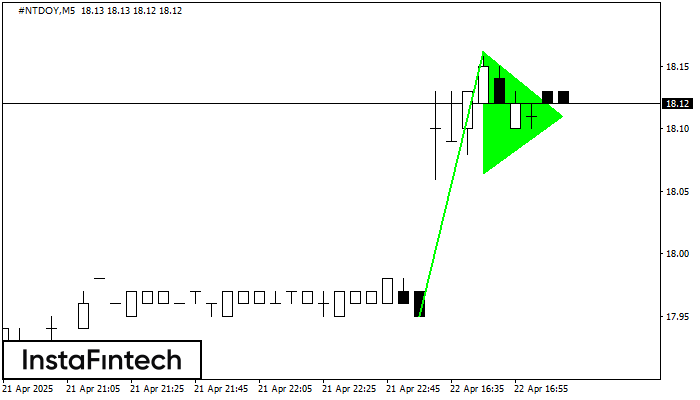
The Bullish pennant signal – Trading instrument #NTDOY M5, continuation pattern. Forecast: it is possible to set up a buy position above the pattern’s high of 18.16, with the prospect
The M5 and M15 time frames may have more false entry points.
Open chart in a new window


