

signal strength 1 of 5
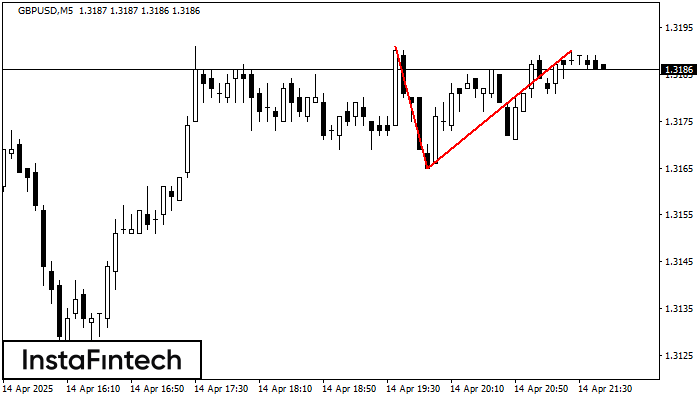
On the chart of GBPUSD M5 the Double Top reversal pattern has been formed. Characteristics: the upper boundary 1.3190; the lower boundary 1.3165; the width of the pattern 25 points. The signal: a break of the lower boundary will cause continuation of the downward trend targeting the 1.3150 level.
The M5 and M15 time frames may have more false entry points.
یہ بھی دیکھیں
- All
- Double Top
- Flag
- Head and Shoulders
- Pennant
- Rectangle
- Triangle
- Triple top
- All
- #AAPL
- #AMZN
- #Bitcoin
- #EBAY
- #FB
- #GOOG
- #INTC
- #KO
- #MA
- #MCD
- #MSFT
- #NTDOY
- #PEP
- #TSLA
- #TWTR
- AUDCAD
- AUDCHF
- AUDJPY
- AUDUSD
- EURCAD
- EURCHF
- EURGBP
- EURJPY
- EURNZD
- EURRUB
- EURUSD
- GBPAUD
- GBPCHF
- GBPJPY
- GBPUSD
- GOLD
- NZDCAD
- NZDCHF
- NZDJPY
- NZDUSD
- SILVER
- USDCAD
- USDCHF
- USDJPY
- USDRUB
- All
- M5
- M15
- M30
- H1
- D1
- All
- Buy
- Sale
- All
- 1
- 2
- 3
- 4
- 5
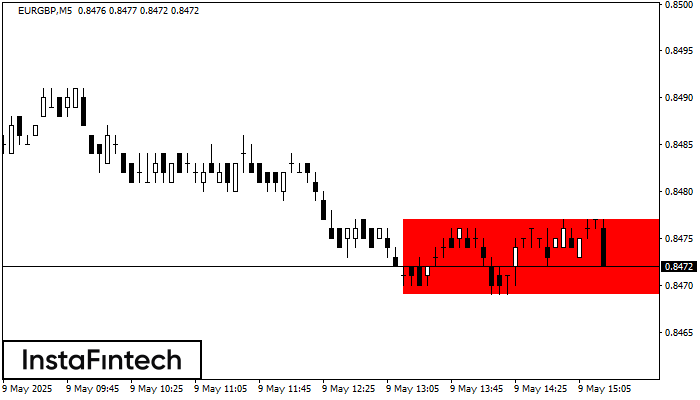
According to the chart of M5, EURGBP formed the Bearish Rectangle. This type of a pattern indicates a trend continuation. It consists of two levels: resistance 0.8477 - 0.0000
The M5 and M15 time frames may have more false entry points.
Open chart in a new window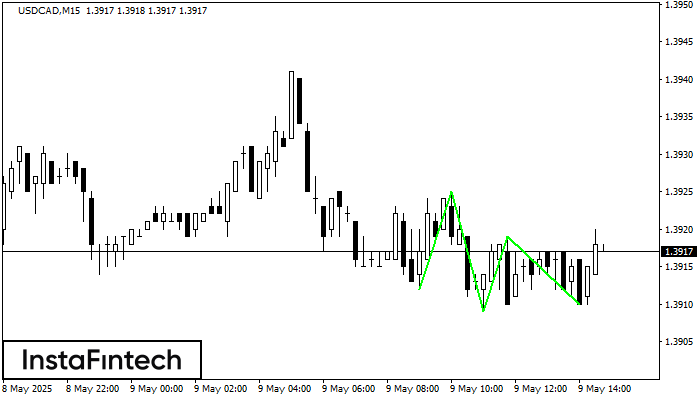
The Triple Bottom pattern has formed on the chart of USDCAD M15. Features of the pattern: The lower line of the pattern has coordinates 1.3925 with the upper limit 1.3925/1.3919
The M5 and M15 time frames may have more false entry points.
Open chart in a new window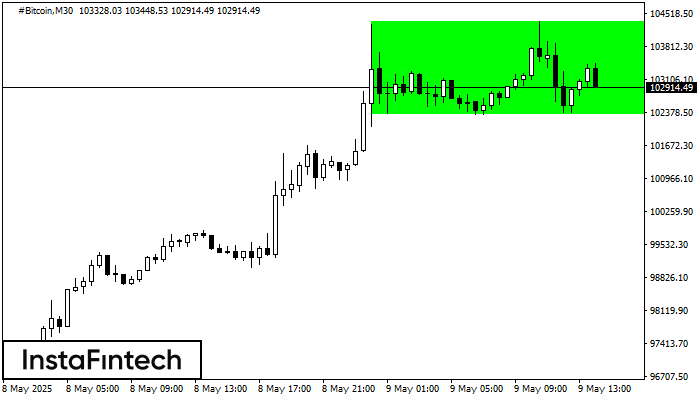
According to the chart of M30, #Bitcoin formed the Bullish Rectangle which is a pattern of a trend continuation. The pattern is contained within the following borders: the lower border
Open chart in a new window


