


signal strength 1 of 5
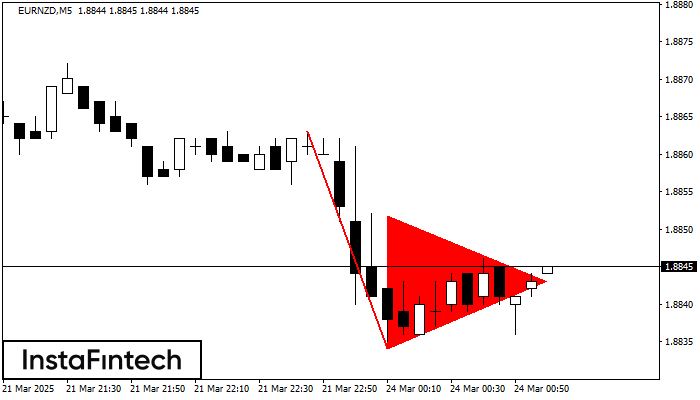
The Bearish pennant pattern has formed on the EURNZD M5 chart. It signals potential continuation of the existing trend. Specifications: the pattern’s bottom has the coordinate of 1.8834; the projection of the flagpole height is equal to 29 pips. In case the price breaks out the pattern’s bottom of 1.8834, the downtrend is expected to continue for further level 1.8819.
The M5 and M15 time frames may have more false entry points.
See Also
- All
- Double Top
- Flag
- Head and Shoulders
- Pennant
- Rectangle
- Triangle
- Triple top
- All
- #AAPL
- #AMZN
- #Bitcoin
- #EBAY
- #FB
- #GOOG
- #INTC
- #KO
- #MA
- #MCD
- #MSFT
- #NTDOY
- #PEP
- #TSLA
- #TWTR
- AUDCAD
- AUDCHF
- AUDJPY
- AUDUSD
- EURCAD
- EURCHF
- EURGBP
- EURJPY
- EURNZD
- EURRUB
- EURUSD
- GBPAUD
- GBPCHF
- GBPJPY
- GBPUSD
- GOLD
- NZDCAD
- NZDCHF
- NZDJPY
- NZDUSD
- SILVER
- USDCAD
- USDCHF
- USDJPY
- USDRUB
- All
- M5
- M15
- M30
- H1
- D1
- All
- Buy
- Sale
- All
- 1
- 2
- 3
- 4
- 5
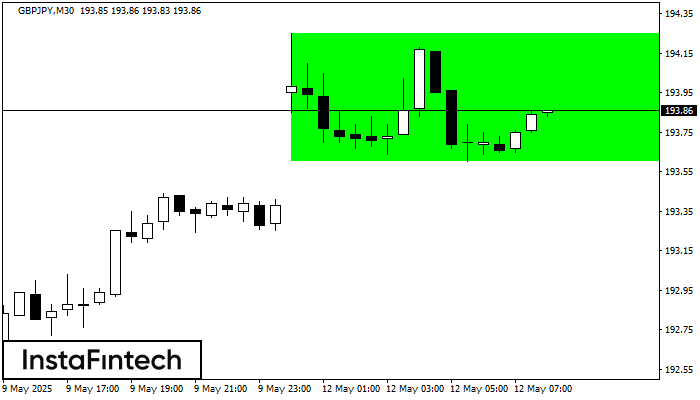
According to the chart of M30, GBPJPY formed the Bullish Rectangle. The pattern indicates a trend continuation. The upper border is 194.25, the lower border is 193.60. The signal means
Open chart in a new window
The Triple Top pattern has formed on the chart of the NZDCHF M15 trading instrument. It is a reversal pattern featuring the following characteristics: resistance level 2, support level -4
The M5 and M15 time frames may have more false entry points.
Open chart in a new window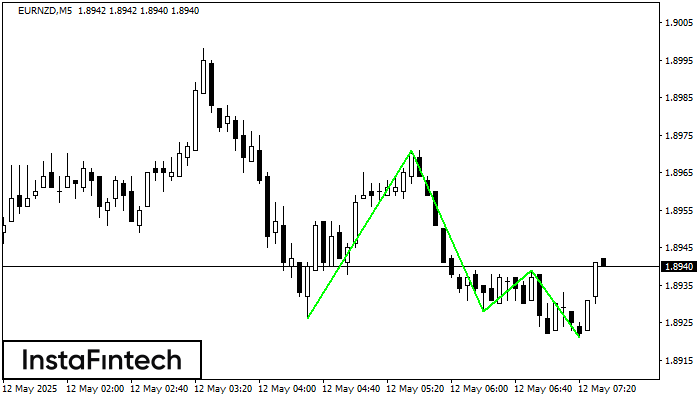
The Triple Bottom pattern has formed on the chart of EURNZD M5. Features of the pattern: The lower line of the pattern has coordinates 1.8971 with the upper limit 1.8971/1.8939
The M5 and M15 time frames may have more false entry points.
Open chart in a new window


