EUR/USD
Brief Analysis:
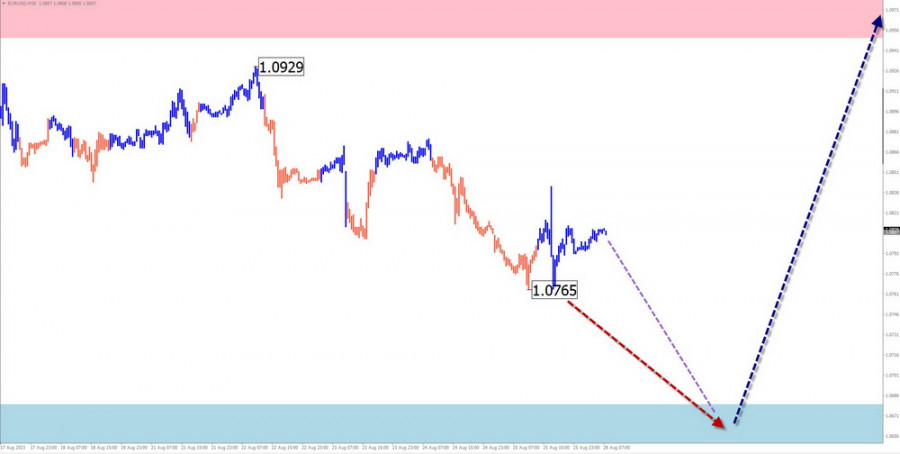
On the euro main pair chart, a descending wave has been developing within the dominant upward trend of the past two months. The wave movement level indicates the formation of a full-fledged correction. The price is approaching the upper boundary of a strong potential reversal zone for the weekly timeframe.
Forecast for the week:
At the beginning of the week, the euro chart likely indicated a decline in the support zone boundaries. In the latter half, expect an increase in volatility, a reversal, and a resumption of the exchange rate's growth. The support zone marks the upper boundary of the probable weekly movement.
Potential Reversal Zones:
Resistance:
Support:
Recommendations:
Selling: might lead to losses.
Buying becomes feasible after confirmed reversal signals emerge in the resistance zone area.
USD/JPY
Brief Analysis:
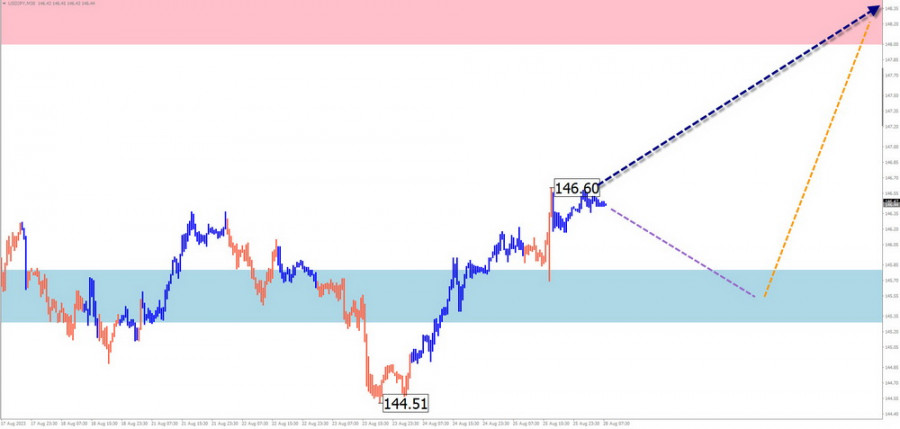
The US dollar strengthens against the Japanese yen in the main pair. The unfinished trend segment started on July 14. Around the 146 mark, the price has moved laterally over the last two weeks.
Forecast for the week:
In the initial days, a lateral mood is more likely. A downward vector cannot be ruled out. The decline is expected no further than the estimated support. By mid-week, anticipate increased activity and a resumption of the upward trend. Price growth can be expected up to the resistance zone.
Potential Reversal Zones:
Resistance:
Support:
Recommendations:
Selling: possible during individual trading sessions in small lots.
Buying: can become the main trading direction after confirmed signals appear in the support zone area.
GBP/JPY
Brief Analysis:
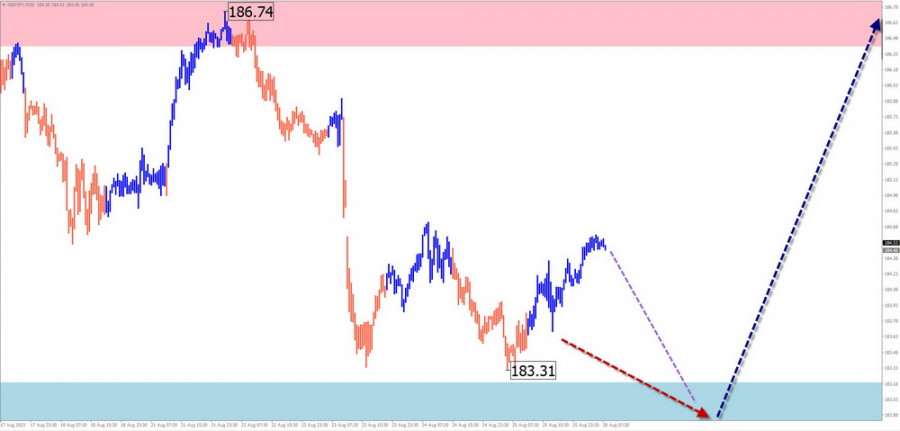
The trend direction has been set by an upward wave since last fall. The final segment of the main course started on July 28. After contacting the lower boundary of strong resistance, the pair's quotes started retreating downward a week ago. The price is moving along the calculated support.
Forecast for the week:
The price will likely continue moving horizontally along the support zone levels in the next couple of days. Closer to the weekend, there's an increasing probability of a reversal and a resumption of the growth rate. When changing direction, volatility is sure to increase sharply. A brief breach of the lower boundary of the support zone cannot be ruled out.
Potential Reversal Zones:
Resistance:
Support:
Recommendations:
Selling: risky due to low potential.
Buying: becomes relevant after confirmed signals in the support zone area are corroborated by your trading systems.
USD/CAD
Brief Analysis:
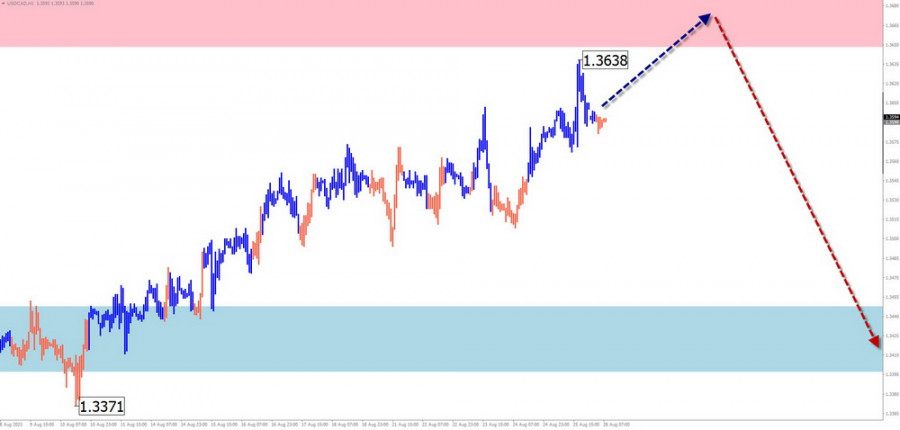
The quotes of the Canadian dollar continue the upward wave that began in July. The quotes are approaching the lower boundary of a strong potential large-scale reversal zone. The structure of this wave seems complete, but there are no imminent reversal signals on the chart.
Forecast for the week:
In the coming days, one can expect a continuation of price growth. In the resistance zone area, in the latter half, there's a high probability of creating conditions for a reversal and the start of a price decline. Price fluctuations of the instrument are expected in the range between opposing zones.
Potential Reversal Zones:
Resistance:
Support:
Recommendations:
Selling: becomes preferable after confirmed signals appear in the support zone area.
Buying: possible but carries a high degree of risk. It's advisable to reduce the trading lot.
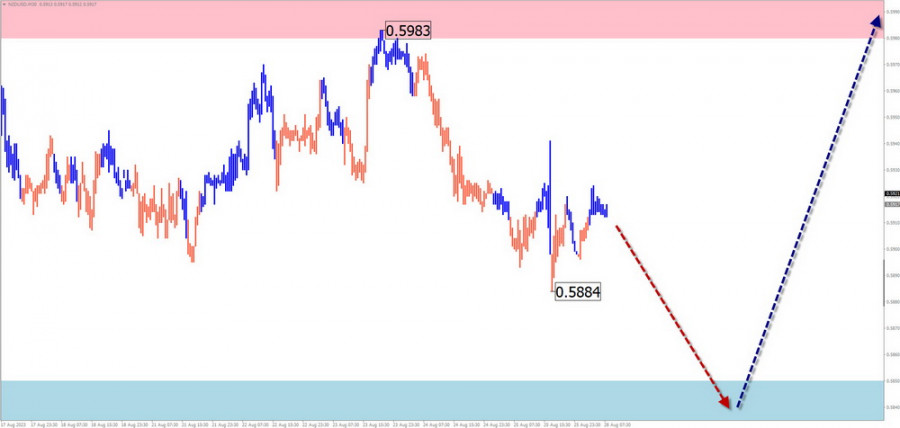
NZD/USD
Brief Analysis:
The New Zealand dollar major continued its downward movement starting in December last year. According to the main course, the unfinished segment has been tracked since July 14. The quotes are approaching the upper boundary of the strong potential reversal zone. The likelihood of breaking through the zone without forming a counterwave is minimal.
Forecast for the week:
At the beginning of the week, a continuation of a sideways flat movement is possible. A brief decline to the support zone cannot be ruled out. After that, it's best to await the formation of a reversal and a change of direction. The calculated resistance indicates the upper boundary of the probable weekly range.
Potential Reversal Zones:
Resistance:
Support:
Recommendations:
Buying: becomes relevant after the appearance of suitable signals from your trading systems in the resistance zone area.
Selling: possible intraday with a small lot. The potential is limited by support.
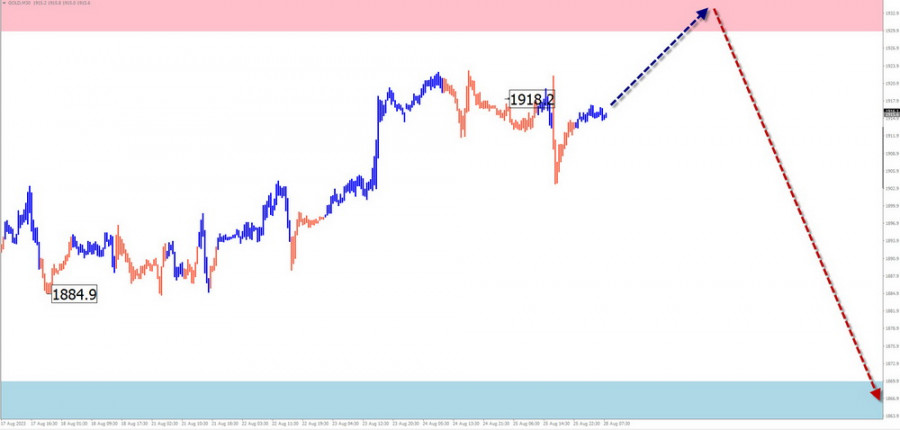
Gold
Brief Analysis:
The price movement direction of gold has been dictated by a bearish wave since March. This segment on a larger timeframe forms a correction in the form of an extended plane. The price is approaching the upper boundary of the preliminary target zone, coinciding with the level of a strong potential reversal zone.
Forecast for the week:
In the coming days, pressure on the resistance zone is possible. A brief breach of its upper boundary cannot be ruled out. Afterward, a reversal and a resumption of the decline are expected. The calculated support shows the lower boundary of the weekly movement.
Potential Reversal Zones:
Resistance:
Support:
Recommendations:
Selling: has low potential and is not recommended.
Buying: suitable conditions for transactions will arise after the appearance of reversal signals in the support zone area.
Notes: In the simplified wave analysis (SWA), all waves consist of 3 parts (A-B-C). On each timeframe, only the last unfinished wave is analyzed. Dotted lines show expected movements.
Attention: The wave algorithm does not account for the duration of instruments' movements over time!


