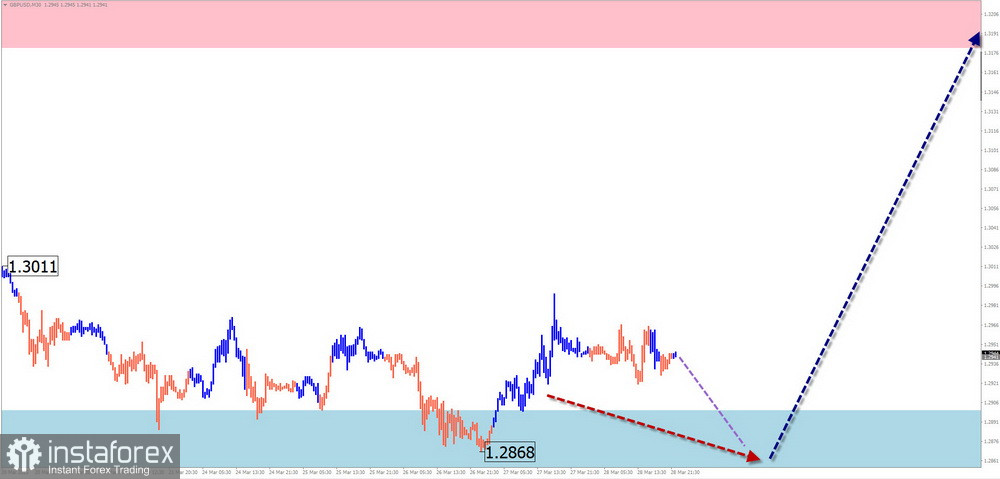
GBP/USD
Analysis: The 4-hour chart analysis of the British pound major shows that the upward wave from January 13 remains incomplete. Its first part (A) has been completed. Since early March, the middle part of wave (B) has been forming in a sideways flat. This wave is developing as a contracting flat and is still incomplete. At the time of analysis, quotes are at the lower boundary of the established price corridor.
Forecast: In the coming days, the flat structure of the pound's movement is expected to complete. In the second half of the week, a reversal may form near the support zone, followed by renewed price growth. The expected weekly upper boundary is shown by the calculated resistance.
Potential Reversal Zones Resistance:
- 1.3180 / 1.3230 Support:
- 1.2900 / 1.2850
Recommendations:
- Selling: No conditions for such trades.
- Buying: Will become relevant after confirmed reversal signals near the support zone.
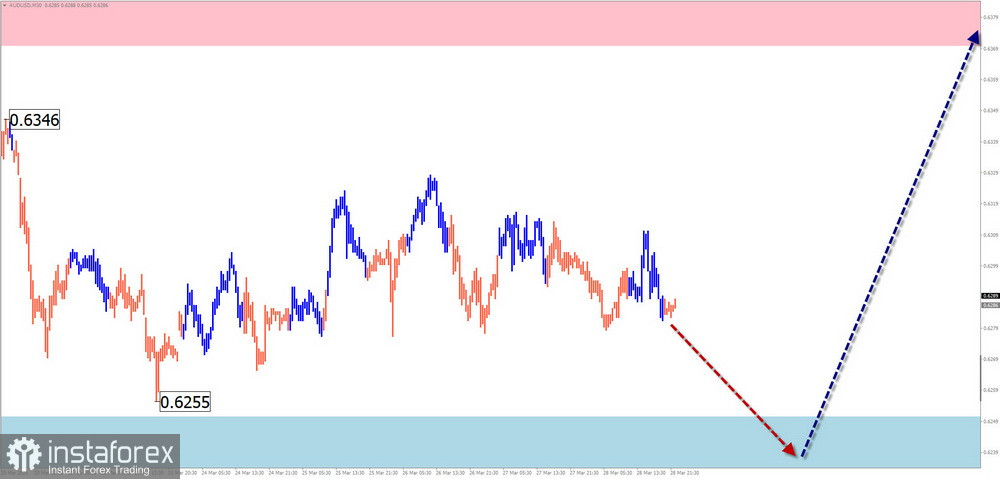
AUD/USD
Analysis: The Australian dollar major has been in an upward wave since February. Throughout the current month, a counter-correction has been developing within it, forming a contracting flat. As of now, this structure remains incomplete. Price is moving in a sideways corridor between opposing zones.
Forecast: During the upcoming week, the AUD/USD pair is expected to remain in a sideways flat. A downward bias is more likely in the first half of the week. A directional shift and renewed price growth may occur closer to the weekend.
Potential Reversal Zones Resistance:
- 0.6370 / 0.6420 Support:
- 0.6250 / 0.6200
Recommendations:
- Selling: Possible with fractional volume sizes in individual sessions; potential is limited by support.
- Buying: May be considered after confirmed reversal signals in the support zone based on your trading systems (TS).
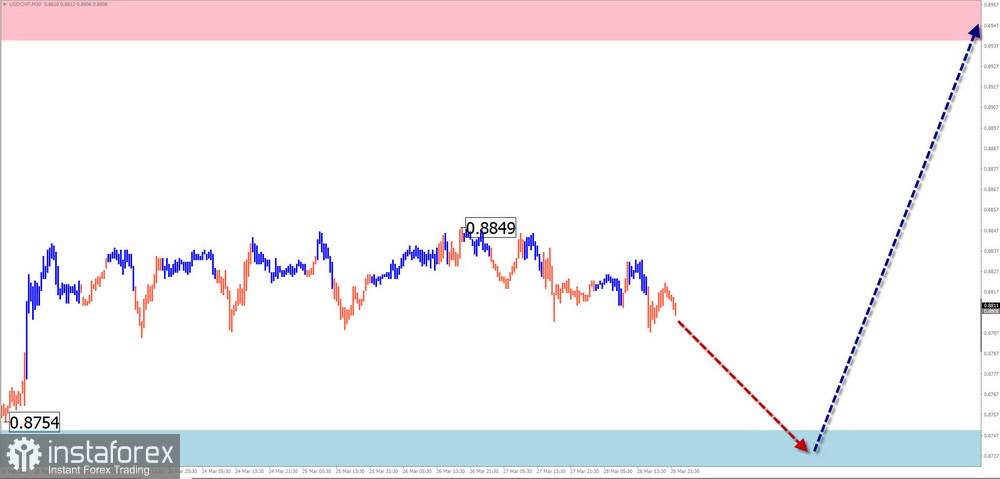
USD/CHF
Analysis: In the short term, USD/CHF price direction is defined by a bearish wave since January last year. On a larger scale, this represents a correction. The pair has reached the upper boundary of the broad potential reversal zone on the daily time frame.
Forecast: At the beginning of the week, the most likely scenario is sideways consolidation along the support zone. A reversal setup is expected later. Price growth may begin closer to the weekend.
Potential Reversal Zones Resistance:
- 0.8940 / 0.8990 Support:
- 0.8750 / 0.8700
Recommendations:
- Selling: No setups expected this week.
- Buying: May be used after confirmed reversal signals appear near the support zone.
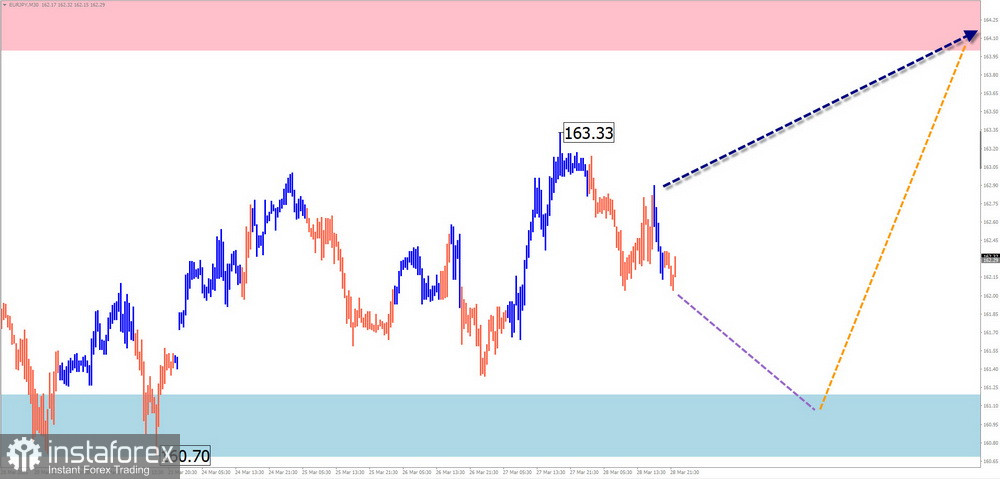
EUR/JPY
Analysis: The global trend continues to push EUR/JPY quotes north on the chart. The price has reached the lower boundary of a strong weekly support zone. Over the past two weeks, a correction has been forming. The wave structure is not yet complete.
Forecast: This week, a completion of the current downward movement is expected, followed by sideways drifting near the support area. Toward the weekend, the likelihood of a reversal and resumed price growth increases.
Potential Reversal Zones Resistance:
- 164.00 / 164.50 Support:
- 161.20 / 160.80
Recommendations:
- Buying: Premature until the current wave completes and reversal signals appear near support.
- Selling: Possible with fractional volumes for intraday trades.
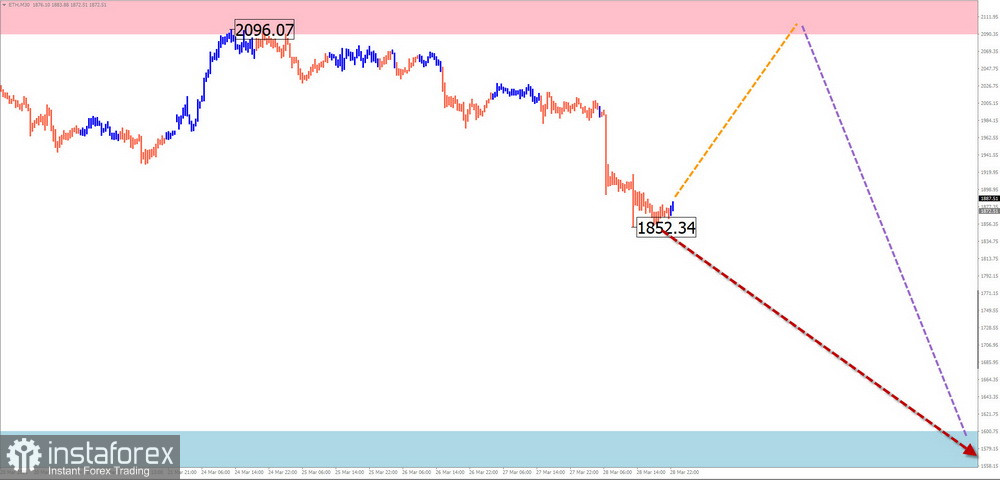
#Ethereum
Analysis: A bearish wave has been forming on Ethereum's chart since early December. In early March, price broke through a key potential reversal zone. For the past two weeks, ETH has been consolidating sideways. The wave structure is still incomplete.
Forecast: The overall sideways movement is expected to continue this week. An upward bias in the first half of the week will likely shift to a downward one by the weekend. A breakout above resistance upon trend change is unlikely.
Potential Reversal Zones Resistance:
- 2090.0 / 2140.0 Support:
- 1600.0 / 1550.0
Recommendations:
- Buying: Possible with fractional volume sizes in select sessions.
- Selling: Premature until confirmed reversal signals appear near resistance.
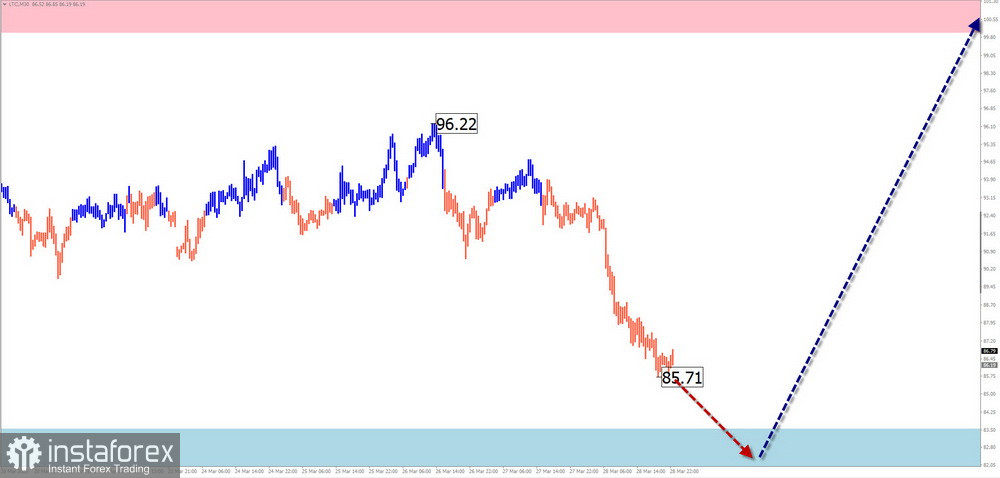
#Litecoin
Analysis: The current wave model on Litecoin's chart is an incomplete upward zigzag. The final wave part (C) began on March 11. Over the past two weeks, an intermediate pullback has been forming within its structure.
Forecast: At the start of the week, a decline to the calculated support zone is most likely. In the second half, the chance of a price recovery increases. The resistance zone sets the upper boundary for the weekly price range.
Potential Reversal Zones Resistance:
- 100.00 / 102.00 Support:
- 83.50 / 81.50
Recommendations:
- Buying: Will be possible after confirmed reversal signals appear in the support zone.
- Selling: High risk, limited potential due to nearby support.
Note: In simplified wave analysis (SWA), all waves consist of 3 parts (A-B-C). The analysis on each time frame focuses on the last, incomplete wave. Dotted lines indicate projected movements.
Attention: The wave algorithm does not account for the duration of instrument movements over time.