


signal strength 1 of 5
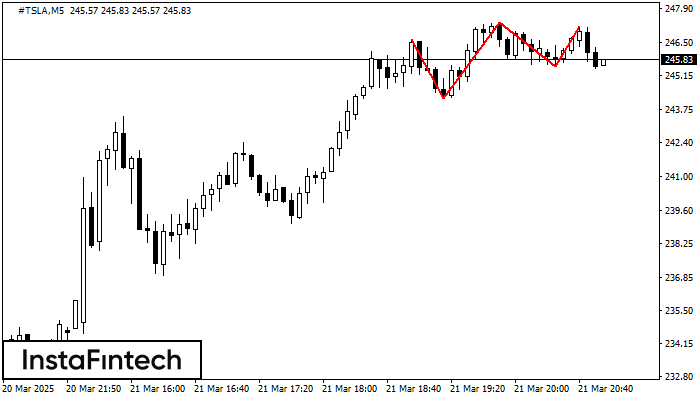
The Triple Top pattern has formed on the chart of the #TSLA M5. Features of the pattern: borders have an ascending angle; the lower line of the pattern has the coordinates 244.22/245.52 with the upper limit 246.65/247.16; the projection of the width is 243 points. The formation of the Triple Top figure most likely indicates a change in the trend from upward to downward. This means that in the event of a breakdown of the support level of 244.22, the price is most likely to continue the downward movement.
The M5 and M15 time frames may have more false entry points.
Veja também
- All
- Double Top
- Flag
- Head and Shoulders
- Pennant
- Rectangle
- Triangle
- Triple top
- All
- #AAPL
- #AMZN
- #Bitcoin
- #EBAY
- #FB
- #GOOG
- #INTC
- #KO
- #MA
- #MCD
- #MSFT
- #NTDOY
- #PEP
- #TSLA
- #TWTR
- AUDCAD
- AUDCHF
- AUDJPY
- AUDUSD
- EURCAD
- EURCHF
- EURGBP
- EURJPY
- EURNZD
- EURRUB
- EURUSD
- GBPAUD
- GBPCHF
- GBPJPY
- GBPUSD
- GOLD
- NZDCAD
- NZDCHF
- NZDJPY
- NZDUSD
- SILVER
- USDCAD
- USDCHF
- USDJPY
- USDRUB
- All
- M5
- M15
- M30
- H1
- D1
- All
- Buy
- Sale
- All
- 1
- 2
- 3
- 4
- 5

De acordo com o gráfico de H1, EURJPY formou o padrão de Triângulo Simétrico de Alta. O limite inferior do padrão toca as coordenadas 162.28/163.37 enquanto o limite superior cruza
Open chart in a new window
O padrão Fundo duplo foi formado em GBPJPY M30. Características: o nível de suporte 193.37; o nível de resistência 194.63; a largura do padrão 126 pontos. Se o nível
Open chart in a new window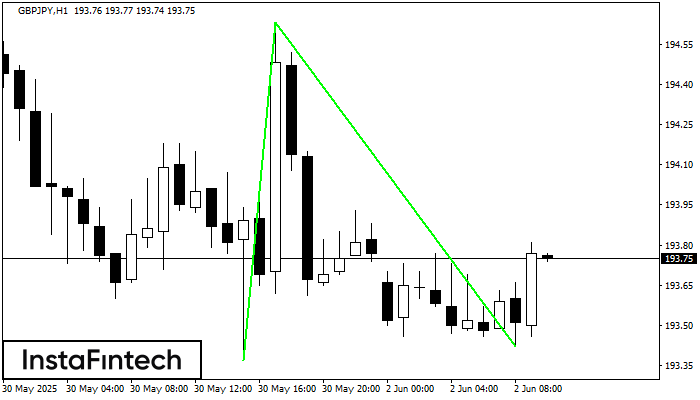
O padrão Fundo duplo foi formado em GBPJPY H1. Esta formação sinaliza uma reversão da tendência de baixo para cima. O sinal é que uma negociação de compra deve
Open chart in a new window


