


signal strength 1 of 5
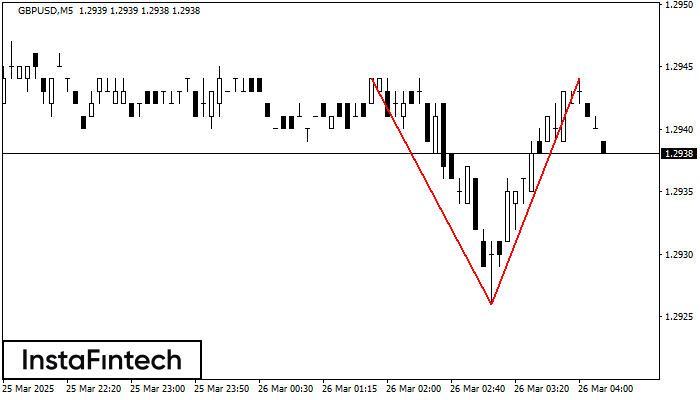
The Double Top pattern has been formed on GBPUSD M5. It signals that the trend has been changed from upwards to downwards. Probably, if the base of the pattern 1.2926 is broken, the downward movement will continue.
The M5 and M15 time frames may have more false entry points.
- All
- Double Top
- Flag
- Head and Shoulders
- Pennant
- Rectangle
- Triangle
- Triple top
- All
- #AAPL
- #AMZN
- #Bitcoin
- #EBAY
- #FB
- #GOOG
- #INTC
- #KO
- #MA
- #MCD
- #MSFT
- #NTDOY
- #PEP
- #TSLA
- #TWTR
- AUDCAD
- AUDCHF
- AUDJPY
- AUDUSD
- EURCAD
- EURCHF
- EURGBP
- EURJPY
- EURNZD
- EURRUB
- EURUSD
- GBPAUD
- GBPCHF
- GBPJPY
- GBPUSD
- GOLD
- NZDCAD
- NZDCHF
- NZDJPY
- NZDUSD
- SILVER
- USDCAD
- USDCHF
- USDJPY
- USDRUB
- All
- M5
- M15
- M30
- H1
- D1
- All
- Buy
- Sale
- All
- 1
- 2
- 3
- 4
- 5
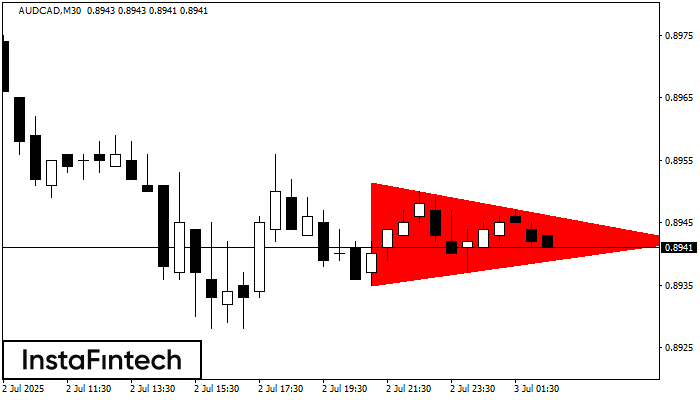
According to the chart of M30, AUDCAD formed the Bearish Symmetrical Triangle pattern. Description: The lower border is 0.8935/0.8942 and upper border is 0.8952/0.8942. The pattern width is measured
Open chart in a new window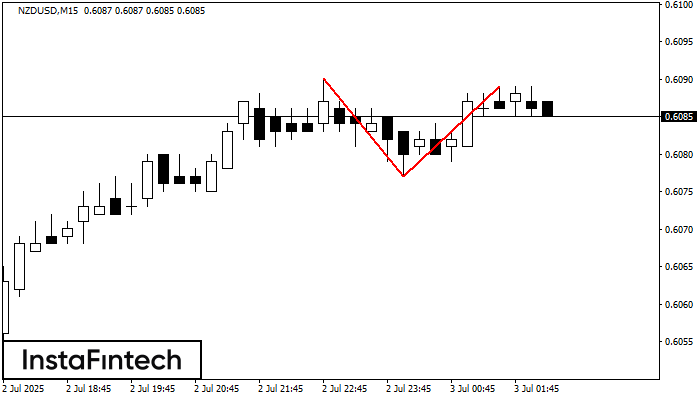
On the chart of NZDUSD M15 the Double Top reversal pattern has been formed. Characteristics: the upper boundary 0.6089; the lower boundary 0.6077; the width of the pattern 12 points
The M5 and M15 time frames may have more false entry points.
Open chart in a new window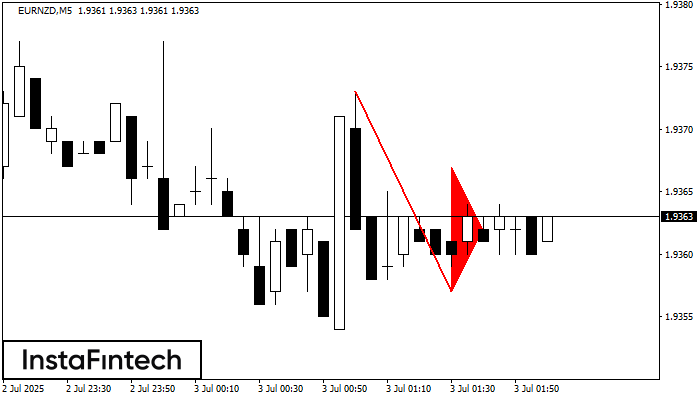
The Bearish pennant pattern has formed on the EURNZD M5 chart. The pattern signals continuation of the downtrend in case the pennant’s low of 1.9357 is broken through. Recommendations: Place
The M5 and M15 time frames may have more false entry points.
Open chart in a new window


